| Home | E-Submission | Sitemap | Contact Us |  
Clinical and Experimental Otorhinolaryngology > Volume 12(3); 2019 > Article
Ufuk, Herek, and Yüksel: Diagnosis of Sarcopenia in Head and Neck Computed Tomography: Cervical Muscle Mass as a Strong Indicator of Sarcopenia

Abstract

Objectives

Patients with head and neck cancer (HNC) have a high risk of sarcopenia, which is associated with poor prognosis. Skeletal-muscle area and index at the third lumbar (L3) vertebra level (L3MA and L3MI) are recommended for the detection of sarcopenia. However, L3 level is not included in many imaging protocols and there are no data for optimal levels and cutoffs for the diagnosis of sarcopenia in head and neck computed tomography (HNCT) scans. Our aim was to assess the relationship between cervical paravertebral muscle values and L3MI and to investigate optimal level to diagnose sarcopenia on HNCTs.

Methods

Patients with HNC (n=159) who underwent positron emission tomography-CT for tumor staging were retrospectively analyzed. On CT images, paravertebral and sternocleidomastoid muscle areas at second (C2), third (C3), and fourth (C4) cervical vertebrae levels (C2MA, C3MA, C4MA, SCMA) and L3MA were measured. Cross-sectional areas were normalized for stature (muscle area/height square) and muscle index (C2MI, C3MI, C4MI, SCMI, L3MI) values were obtained. Spearman correlation and linear regression analyses were used for assessing correlations. To calculate the diagnostic performance of SCMI, C2MI, C3MI, and C4MI for the diagnosis of sarcopenia with respect to the cutoffs of L3MI, receiver operating characteristic (ROC) analysis was used.

Results

Males had significantly higher muscle areas than females. Although C2MI, C3MI, C4MI, and SCMI values all showed very strong and significant correlation with L3MI (P<0.001). According to the ROC analysis, the best discriminative for sarcopenia was C3MI in males (area under curve [AUC], 0.967) and SCMI in females (AUC, 0.898).

Conclusion

C2MI, C3MI, C4MI, and SCMI values can be used as alternatives for the diagnosis of sarcopenia in routine HNCT examinations.

INTRODUCTION

Cachexia is a common finding in patients with malignancy, especially in head and neck cancers (HNCs) [1,2]. Assessment of skeletal muscle mass (SMM) and function are important for the detection of cachexia and malnutrition. Decreased muscle function and SMM is defined as sarcopenia which is associated with poor clinical outcomes such as longer postoperative recovery, increased infection rate, impaired health related quality of life, higher risk of falling, increased health care costs and increased mortality [1-7]. For the diagnosis of sarcopenia, detection of decreased SMM was recommended and computed tomography (CT) is a useful and precise tool for the quantitative detection of SMM [8-10].
For assessing SMM on CT, skeletal muscle cross-sectional area (SMA) and skeletal muscle index (SMI; height2-adjusted SMA) at the level of the third lumbar vertebra (L3) is prevalently used and highly correlates with whole body SMM [2,3,10]. To classify patients as sarcopenic or not, sex-specific cutoff values for SMI at L3 (L3MI) are used [9-12]. Positron emission tomography-CT (PET-CT) scan can also be used to evaluate sarcopenia by measuring SMA at L3 vertebral level. However, L3 vertebrae is not included in several CT examination protocols, such as chest, pelvis or head and neck CT examinations. Some investigators have assessed alternative measurements for the detection of sarcopenia in patients with chest-only CT or pelvis-only CT examinations [13-17]. Swartz et al. [18] compared SMA at L3 level (L3MA) and paravertebral muscle area at the third cervical vertebrae level (C3MA) in 103 subjects (51 trauma patients and 52 patients with malignancy) and they have reported that C3MA may be an alternative to L3MA in head and neck CT examinations. However, there is a lack of an optimal reference cervical vertebrae level for the measurement of SMM on head and neck CT examinations which is routinely obtained as part of an oncological examination. Also, there is a lack of cutoff values for the detection of sarcopenia in routine head and neck CT examinations.
Our aim was to assess the relationship between SMA of the paravertebral muscles at three separate cervical vertebrae levels (C2, C3, and C4) and at the L3 level, and to investigate optimal level to diagnose sarcopenia on head and neck-only CT examinations. We also aimed to define means, and sarcopenia cutoff values for both sexes, on head and neck CT examinations at the cervical vertebrae levels mentioned above.

MATERIALS AND METHODS

This study was approved by Ethics Committee of the Pamukkale University Faculty of Medicine (No. 60116787-020/71492) and a waiver of the requirement for informed consent was granted.

Patients

The medical records of 197 patients (63.3±11.9 years) with HNC who underwent PET-CT for tumor staging at our tertiary medical center between January 2012 and May 2018 were retrospectively analyzed. Patients with unenhanced CT examination of the entire body were included. Exclusion criteria were missing or incomplete CT images and insufficient CT image quality. In the staging of all patients, the eighth edition of TNM Classification for Head and Neck Cancer by the American Joint Committee on Cancer was used. We used performance status (PS) scaling defined by the Eastern Cooperative Oncology Group (ECOG) to assess the patients’ PS [19]. The characteristics of this PS scale are shown in Table 1.

CT examination

All CT examinations of the whole body were performed in a craniocaudal direction, using a multi-detector CT scanner (16-detector row, Brilliance; Philips Healthcare, Best, the Netherlands). CT protocol parameters were tube current of 50–120 mA, tube voltage of 90–140 kV, matrix of 512×512, rotation time of 0.75 second, pitch of 1 and slice thickness of 5 mm. The tube voltage and tube current were adjusted to the patient’s body weight. Contrast medium was not used before or during CT exams.

Evaluation of CT images

Before the quantitative tissue assessment, all CT images were fully anonymized and assessed for the presence of artifacts or posterior paravertebral mass or lymphadenopathy which may hinder SMA measurement by a board-certified radiologist (FU) who was unaware of any patient information. Osirix software was used (v9.0; Pixmeo SARL, Bernex, Switzerland) for quantitative SMA measurements. Skeletal muscle was identified and quantified by use of Hounsfield unit thresholds (–29 to +150). All quantitative assessments were made in two different sessions to avoid recall by a single trained radiologist (FU).
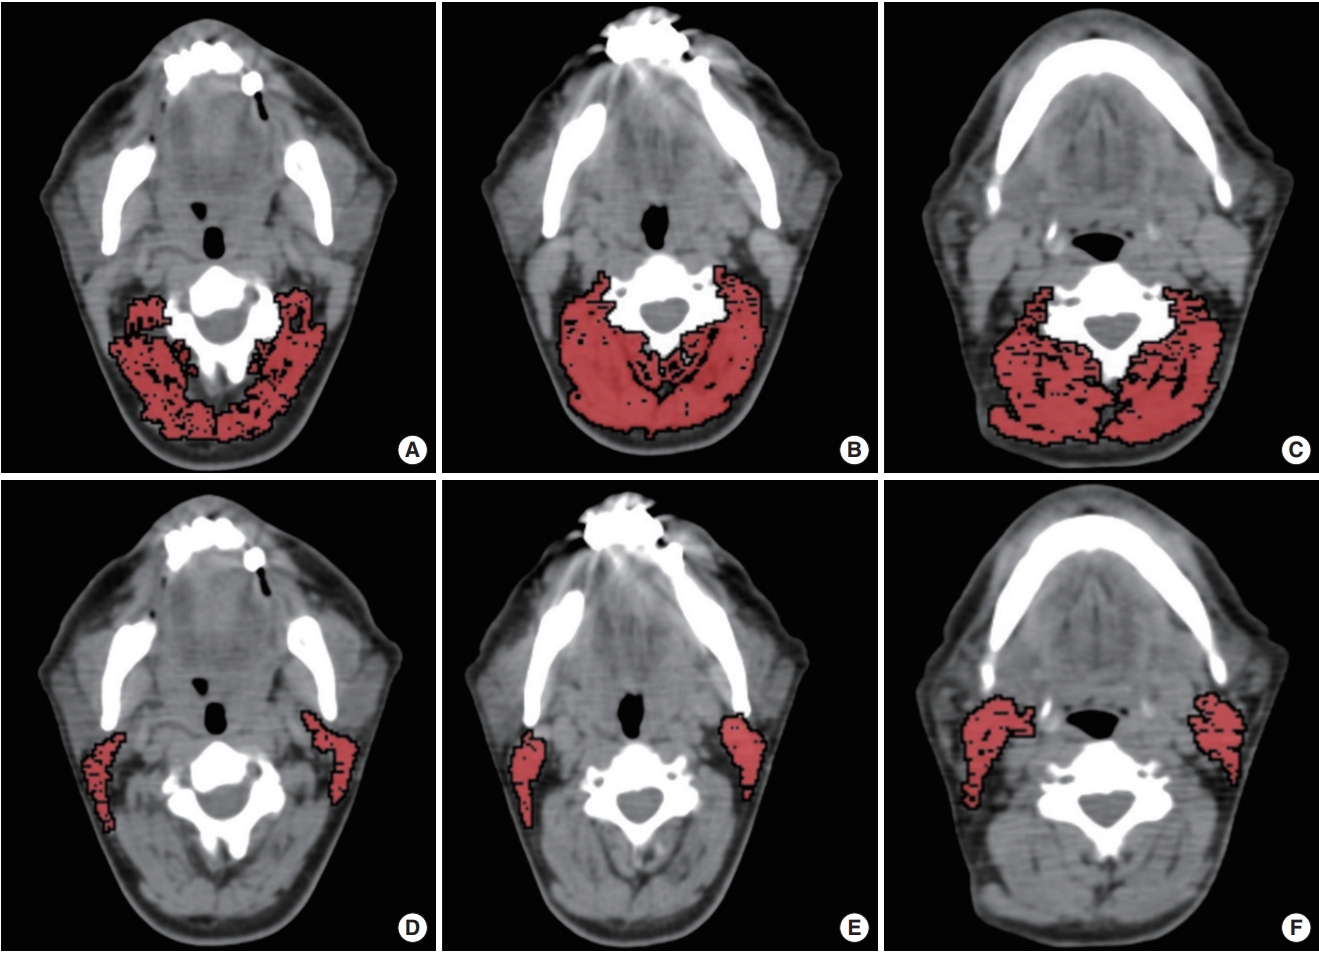
In the first session, the second, third, and fourth cervical vertebrae levels (C2, C3, and C4) were chosen to measure paravertebral muscle areas. Paravertebral skeletal muscle areas were measured from the levels of transverse processes of C2, C3, and C4 vertebrae (Fig. 1). The C2 level contains levator scapula, multifidus, longissimus capitis, obliquus capitis inferior, semispinalis capitis, splenius capitis and trapezius muscles. The C3 level contains rotatores cervicis, levator scapula, longissimus capitis, semispinalis cervicis, semispinalis capitis, splenius capitis, and trapezius muscles. The C4 level contains rotatores cervicis, levator scapula, semispinalis cervicis, semispinalis capitis, multifidus, longissimus cervicis, splenius capitis and trapezius muscles. Since sternocleidomastoid (SCM) muscles may be affected by malignancy (infiltration) or treatment (surgery or radiotherapy) in patients with HNC; we evaluated them separately at C2, C3, and C4 levels. Sum of the bilateral SCM muscle areas was measured separately and the arithmetic mean of the SCM areas at levels C2, C3, C4 were used for SCM area (SCMA).
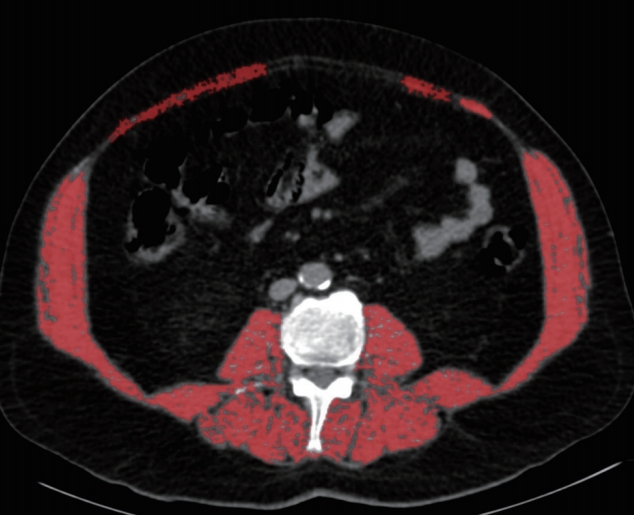
A second session was held 1 week after the first session and, at the lower part of the third lumbar vertebrae (L3) level sum of the all skeletal muscle area was measured which was described by Prado et al. (Fig. 2) [9].
Cross-sectional areas (cm2) were computed for each image, and these values were normalized for stature (height in m2) (C2, C3, C4, and L3 SMI, SCM muscle index; cm2/m2). Body mass index (BMI) was also computed as weight divided by height squared (kg/m2). For detection of low SMM, existing cutoff values of L3MI of ≤52.4 cm2/m2 in males and ≤38.9 cm2/m2 in females were used, as previously recommended [9,12]. Patients with high PS (>1) and low SMM values were considered sarcopenic.

Statistical analysis

IBM SPSS ver. 21.0 (IBM Corp., Armonk, NY, USA) was used for analyses. Continuous variables are represented as mean with standard deviation or median with range, respectively in normally and non-normally distributed data. Categorical variables are represented as percentage. Mann-Whitney U-test or Student t-test was used for analyzing continuous data. Spearman correlation coefficients (r) and linear regression analyses were used for assessing correlations between the continuous variables. To calculate the diagnostic performance of SCM, C2, C3, and C4 muscle index (SCMI, C2MI, C3MI, and C4MI) for the diagnosis of low SMM with respect to the cutoffs of L3MI, receiver operating characteristic (ROC) analysis was used [9,12]. A P<0.05 was considered statistically significant. Correlation coefficient value between 0.2 and 0.4 was considered as weak correlation, between 0.4 and 0.6 was considered as moderate correlation, between 0.6 and 0.8 was considered as strong correlation and >0.8 was considered as very strong correlation.

RESULTS

Of the 197 patients with HNC who underwent CT examination, 38 were excluded (27 for missing or incomplete CT examination; 11 for poor image quality due to artifacts). The total study population consisted of 159 subjects (age, 62.2±12.1 years; range, 19 to 86 years), of whom 85 (53.4%) were male. Of the 159 patients with HNC, seven (4.4%) had stage 0 disease and 69 (43.4%) had stage 1 disease (Table 2). One or both SCMA was not measured in 11 of 159 patients because of the tumoral infiltration (n=3, one of them was sarcopenic) and lymph node metastasis (n=8, five of them was sarcopenic). Measurement of the C2MA, C3MA, and C4MA was possible in all of the patients. Males height was significantly greater than females (P<0.001). When L3MI cutoff values (≤52.4 and ≤38.9 cm2/m2 for males and females, respectively) accepted as reference gold standard for the diagnosis of low SMM, 82 patients (51.6%) had low SMM. In 80 patients with low SMM had >1 PS and these patients were considered sarcopenic. Detailed characteristics of the patients and clinical data are given in Table 2. The prevalence of sarcopenia according to the stage of disease are shown in Table 3.
Males had significantly higher C2MA, C2MI, C3MA, C3MI, C4MA, C4MI, SCMA, L3MA, and L3MI values than females. Although, SCMI values in males were greater than those of females, no statistical significance was observed (Table 2). Although C2MI, C3MI, C4MI, and SCMI values all showed very strong and significant correlation with L3MI, C3MI showed the strongest correlation (r=0.877). The correlation values between L3MI and C2MI, C3MI, C4MI, SCMI and variables are shown in Table 4.
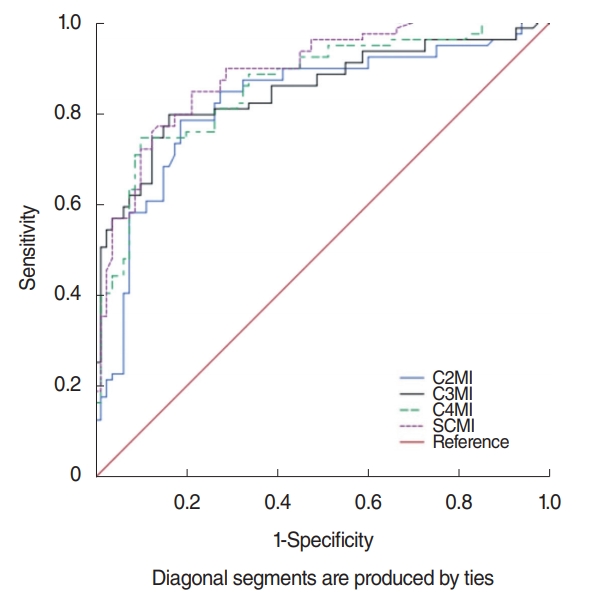
When previously described, L3MI cutoff values [9,12] were accepted as reference gold standard for the diagnosis of low SMM, in patients with restricted physical activity the evaluation of C2MI, C3MI, C4MI, and SCMI values as discriminators of sarcopenic and not sarcopenic patients was performed utilizing ROC curve analysis. According to the ROC analysis in the total population (males and females) showed in Fig. 3, area under curve (AUC) was 0.825 (95% confidence interval [CI], 0.757 to 0.892) in C2MI, 0.851 (95% CI, 0.790 to 0.912) in C3MI and 0.861 (95% CI, 0.804 to 0.919) in C4MI, while SCMI constituted the best discriminative for sarcopenia with AUC of 0.888 (95% CI, 0.838 to 0.938). However, as gender is an important factor on SMM, C3MI constituted the best discriminative for sarcopenia in males with AUC of 0.967 (95% CI, 0.932 to 1) and SCMI constituted the best discriminative for sarcopenia in females with AUC of 0.898 (95% CI, 0.829 to 0.967) (Fig. 4).
There was a moderate negative correlation between all of the measured skeletal muscle areas and indexes with PS (P<0.001 for all). There was also a weak negative correlation between all of the measured skeletal muscle areas and indexes with tumor stage. Tumor stage was significantly correlated with PS (P<0.001, r=0.331). There was a significant correlation between PS, tumor stage and the presence of sarcopenia (P<0.001 for both, r=0.741 for PS and r=0.386 for stage).
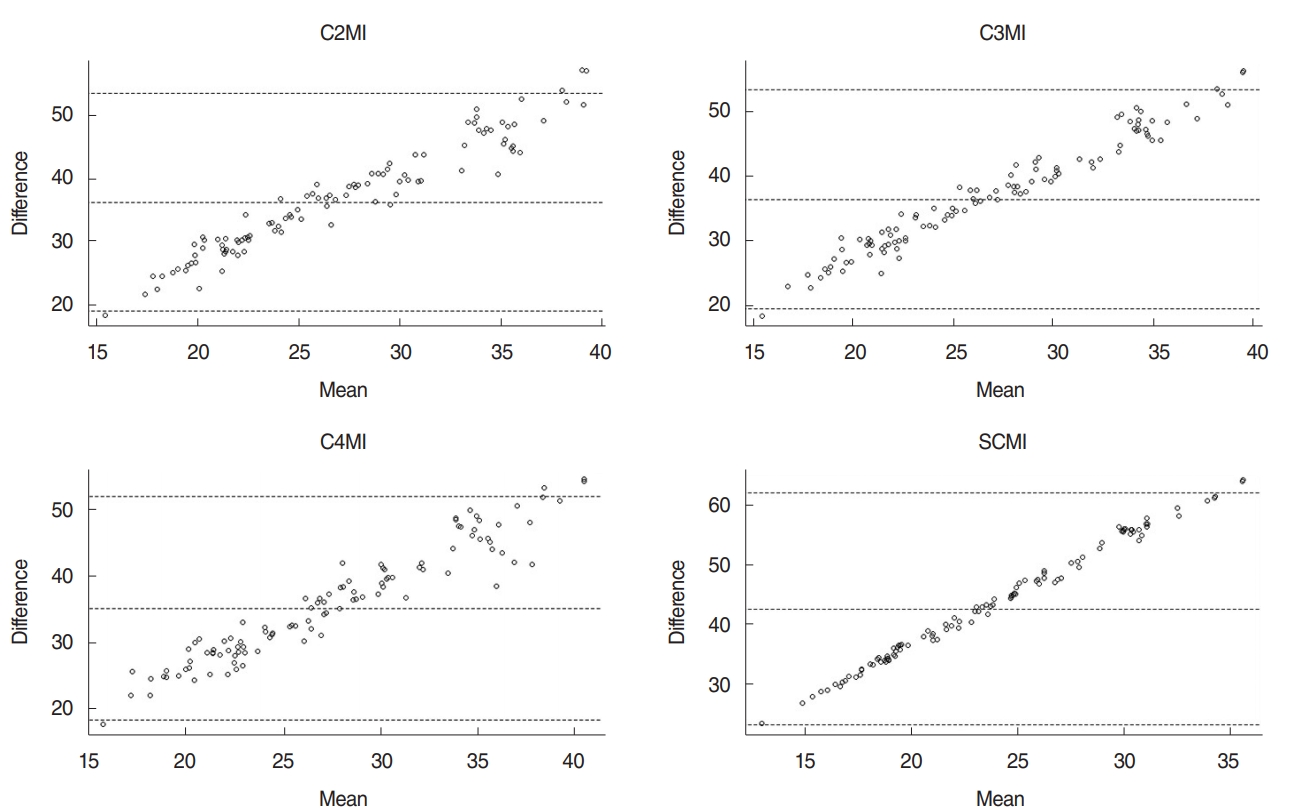
In the multivariable regression analysis using covariables (age, weight, and BMI), C2MI, C3MI, C4MI, and SCMI were the significant predictor of L3MI (P=0.001 for all). Prediction rules were established and shown in Table 5. When L3MI cutoff values (≤52.4 and ≤38.9 cm2/m2 for males and females, respectively) accepted as reference gold standard for the detection of sarcopenia, using above-mentioned regression model C2MI, C3MI, C4MI, and SCMI cutoffs were calculated (Table 6). Bland-Altman analysis did not reveal any significant bias between predicted and measured L3MI values (Fig. 5).

DISCUSSION

Our study demonstrated that C2MI, C3MI, C4MI, and SCMI values showed very strong and significant correlation with L3MI, and all these values can be used as alternatives for the diagnosis of sarcopenia in routine head and neck CT examinations. Though SCM muscle may be affected in patients with HNC, SCMI measurement can be used as a simple and successful method for the detection of sarcopenia in both males and females when not affected.
Cachexia and sarcopenia are common in patients with HNC [1,2]. Measurement of the L3MI is a reliable method and recommended as the gold standard for assessment of SMM and sarcopenia, but this level is rarely available in HNC patients [9,12,18]. Obtaining abdominal or lumbar CT scan for this aim alone would result in additional cost and radiation exposure. Swartz et al. [18] investigated C3MA in 103 subjects (51 control and 52 patients with HNC) and they have reported that C3MA showed strong correlation with L3MA. However, cross-sectional muscle areas normalized for stature, also known as SMI (cm2/m2), is recommended for the detection of SMM. Also, there is a lack of an optimal reference cervical vertebrae level for the measurement of SMM on head and neck CT scans. We therefore investigated the optimal cervical vertebra level to diagnose sarcopenia on head and neck-only CT scans. We also established the sex-specific cutoff values of SMI at cervical vertebra levels (C2, C3, and C4) for the detection of low SMM. These values can be used to diagnose sarcopenia in the presence of restriction in physical activity.
Patients with sarcopenia are prone to higher toxicity of chemotherapy, longer postoperative recovery, increased infection rate, impaired health related quality of life, higher risk of falling, increased health care costs and increased mortality [1-7,20]. Swartz et al. [18] reported that HNC patients had lower SMA values than controls and they suggest that sarcopenia may be seen prevalently in HNC patients. However, for the diagnosis of sarcopenia, knowledge of normalized muscle area for stature is recommended [8,9,12]. Because SMM varies between groups that are similar in skeletal muscle area but different in height, comparing only the SMA between populations is not proper. Also, the number of cases in the study by Schwartz et al. [18] is relatively small. In our study, we found that 80 of 159 patients (50.3%) with HNC had sarcopenia by using L3MI cutoff values and sarcopenia was more common in males (50 vs. 30, P=0.021).
There may also be a negative correlation between SMM and stage of the malignancy (HNC), as larger masses have a higher metabolism [18]. In accordance with this data, we found a significant correlation between tumor stage and the presence of sarcopenia (P<0.001, r=0.386).
Assessment of SCMA on CT images in patients with HNC can be impaired by the tumor infiltration or lymphadenopathies. Most of the HNC patients have lymphadenopathy at the initial diagnosis [21]. Although, measurement of the C2MA, C3MA, and C4MA was possible in all of the patients in our study, presence of lymphadenopathies caused impairment in the measurement of SCMA in 6.9% of patients with HNC (11 of 159). Similarly, Swartz et al. [18] reported impairment in the measurement of SCMA at C3 level in 11% of the patients with HNC. To overcome the problems caused by improper measurements of SCMA we established alternative measurements as C2MA, C3MA, and C4MA.
In conclusion, assessing C2MI, C3MI, C4MI, and SCMI on head and neck CT appears to be good alternatives to abdominal CT scans, based on the very strong correlation with L3MI. Regardless of gender differences, SCMI is the best and most easily applicable alternative method for L3MI in the detection of sarcopenia. We also established the sex-specific cutoff values for those levels which will allow researchers to investigate the clinical importance and impact of sarcopenia in HNC patients, without additional costs or radiation exposure.

HIGHLIGHTS

• Sarcopenia is associated with poor prognosis.
• Patients with head and neck cancer have a high risk of sarcopenia.
• Assessing muscle parameters on head and neck computed tomography is a successful tool to detect sarcopenia.

CONFLICT OF INTEREST

No potential conflict of interest relevant to this article was reported.

Notes

Authors’ contributions

Conceptualization, Data curation, Formal analysis, Methodology, Project administration, Visualization & Writing - original draft: FU. Writing - review & editing: DH, DY.

ACKNOWLEDGMENTS

The authors acknowledge Dr. Hande Şenol (Department of Biostatistics, Pamukkale University, Denizli, Turkey) for her help with statistical analyzes for this study.

Fig. 1.
Paravertebral and sternocleidomastoid muscle areas measurements. The paravertebral muscle area measurements at second (C2, A), third (C3, B), and fourth (C4, C) cervical vertebrae levels. The sternocleidomastoid muscle area measurements at C2 (D), C3 (E), and C4 (F) levels.
ceo-2018-01613f1.jpg
Fig. 2.
Example of skeletal muscle area measurement at the lower part of the third lumbar vertebrae (L3) level.
ceo-2018-01613f2.jpg
Fig. 3.
Receiver operation characteristic curve for prediction of sarcopenia for the assessment of C2MI, C3MI, C4MI, and SCMI in the study total population (males and females). C2MI–C4MI, normalized paravertebral skeletal muscle areas at the level of C2–C4 vertebrae values for stature; SCMI, normalized sum of the bilateral sternocleidomastoid muscle areas at the levels of C2, C3, and C4 vertebrae values for stature.
ceo-2018-01613f3.jpg
Fig. 4.
Receiver operation characteristic curve for prediction of sarcopenia for the assessment of C3MI in males (A) and C4MI in females (B). AUC, area under the curve; CI, confidence interval; C2MI–C4MI, normalized paravertebral skeletal muscle areas at the level of C2–C4 vertebrae values for stature; SCMI, normalized sum of the bilateral sternocleidomastoid muscle areas at the levels of C2, C3, and C4 vertebrae values for stature.
ceo-2018-01613f4.jpg
Fig. 5.
Bland-Altman plots show the agreement of the L3MI and cervical paravertebral muscle indexes (C2MI, C3MI, C4MI, and SCMI) measurements. C2MI–C4MI, normalized paravertebral skeletal muscle areas at the levels of second (C2), third (C3), and fourth (C4) cervical vertebrae values for stature; SCMI, normalized sum of the bilateral sternocleidomastoid muscle areas at the levels of C2, C3, and C4 vertebrae values for stature; L3MI, normalized sum of the all skeletal muscle area at the lower part of L3 level value for stature.
ceo-2018-01613f5.jpg
Table 1.
Performance status scale [19]
Performance status Definition
0 Fully active; no performance restrictions
1 Strenuous physical activity restricted; fully ambulatory and able to carry out light work.
2 Capable of all self-care but unable to carry out any work activities. Up and about >50% of waking hours.
3 Capable of only limited self-care; confined to bed or chair >50% of waking hours.
4 Completely disabled; cannot carry out any self-care; totally confined to bed or chair.
Table 2.
Detailed characteristics of the patients
Variable All subjects Male Female P-value
No. of subjects 159 85 74 -
Age (yr) 62.2±12.1 (19–86) 62.2±10.1 (37–83) 62.3±14.2 (19–86) 0.661*
Weight (kg) 72±11.1 (39–99) 71.9±15.8 (45–109) 67.4±13.3 (38–98) 0.051
Height (cm) 165.3±8.3 (148–190) 170.1±6.8 (154–190) 159.9±7.5 (148–175) <0.001
Body mass index (kg/m2) 25.6±5.7 (15.9–44.8) 24.9±5.7 (15.9–44.8) 26.4±5.5 (16.7–41.4) 0.091
Stage 0.004
 0 7 (4.4) 1 (1.2) 6 (8.1)
 1 69 (43.4) 30 (35.3) 39 (52.7)
 2 43 (27) 29 (34.1) 14 (18.9)
 3 35 (22) 21 (24.7) 14 (18.9)
 4 5 (3.2) 4 (4.7) 1 (1.4)
Performance status 0.859
 0 31 (19.5) 16 (18.8) 15 (20.3)
 1 35 (22) 18 (21.2) 17 (23)
 2 51 (32.1) 32 (37.7) 19 (25.7)
 3 37 (23.3) 16 (18.8) 21 (28.3)
 4 5 (3.2) 3 (3.5) 2 (2.7)
Sarcopenia 0.021
 Yes 80 (50.3) 50 (59.5) 30 (40)
 No 79 (48.7) 34 (40.5) 45 (60)
Location of HNC <0.001
 Nasopharynx 60 (37.7) 51 (60) 9 (12.2)
 Oral cavity 4 (2.5) 4 (4.7) -
 Hypopharynx 32 (20.1) 8 (9.4) 24 (32.4)
 Oropharynx 34 (21.4) 6 (7.1) 28 (37.8)
 Larynx 29 (18.2) 16 (18.8) 13 (17.6)

Values are presented as mean±standard deviation (range) or number (%).

HNC, head and neck cancer.

* Nonparametric test was used.

Table 3.
Prevalence of sarcopenia according to the stage of disease
Stage Sarcopenia
Negative Positive Total
0 7 (8.9) 0 7 (4.4)
1 50 (63.3) 19 (23.7) 69 (43.4)
2 6 (7.6) 37 (46.3) 43 (27)
3 16 (20.2) 19 (23.7) 35 (22)
4 0 5 (6.3) 5 (3.2)
Total 79 (100) 80 (100) 159 (100)

Values are presented as number (%).

Table 4.
Sex-specific measurement results
Variable Total Male Female P-value
C2MA (cm2) 23.1±6.6 26.2±6.7 19.7±4.4 <0.001
C2MI (cm2/m2) 8.4±2.2 9.1±2.4 7.7±1.6 0.001
C3MA (cm2) 22.7±6.2 25.2±6.3 19.9±4.8 <0.001
C3MI (cm2/m2) 8.3±2.1 8.8±2.3 7.7±1.6 0.012
C4MA (cm2) 26.3±7.2 28.7±7.3 23.5±6 <0.001
C4MI (cm2/m2) 9.6±2.4 9.9±2.6 9.2±2.2 0.047
SCMA (cm2) 6±1.9 6.5±2.1 5.4±1.3 0.002
SCMI (cm2/m2) 2.2±0.6 2.2±0.7 2.1±0.5 0.548
L3MA (cm2) 122.7±32.7 136.2±34.8 107.1±21.6 <0.001
L3MI (cm2/m2) 44.7±10.4 47.1±11.9 41.8±7.5 0.003

Values are presented as mean±standard deviation.

C2MA–C4MA, paravertebral skeletal muscle areas at second (C2), third (C3), and fourth (C4) cervical vertebrae levels; C2MI–C4MI, normalized C2MA–C4MA values for stature; SCMA, sum of the bilateral sternocleidomastoid muscle areas at the levels of C2, C3, and C4 vertebrae; SCMI, normalized SCMA values for stature; L3MA, sum of the all skeletal muscle area at the lower part of the third lumbar vertebrae (L3) level; L3MI, normalized L3MA values for stature.

Table 5.
Correlation of variables with L3MI
Variable r P-value
C2MI 0.810 <0.001
C3MI 0.877 <0.001
C4MI 0.827 <0.001
SCMI 0.801 <0.001
Sex –0.255 0.001
Age –0.191 0.016
Height 0.092 0.249
Weight 0.383 <0.001
BMI 0.327 <0.001
Stage of disease –0.119 0.135
Location of tumor –0.109 0.172

L3MI, normalized sum of the all skeletal muscle areas at the lower part of the third lumbar vertebrae (L3) level value for stature; C2MI–C4MI, normalized paravertebral skeletal muscle areas at the levels of second (C2), third (C3), and fourth (C4) cervical vertebrae values for stature; SCMI, normalized sum of the bilateral sternocleidomastoid muscle areas at the levels of C2, C3, and C4 vertebrae values for stature; BMI, body mass index.

Table 6.
The cutoff values and prediction rule for C2MI, C3MI, C4MI, and SCMI obtained by multivariable analysis and the diagnostic performance of these values in the diagnosis of sarcopenia
Variable Cutoff value Prediction rule Sensitivity (%) Specificity (%) R2
Male
 C2MI 9.3 L3MI=3.724×C2MI+17.496 88.2 85.3 0.714
 C3MI 9.3 L3MI=4.226×C3MI+12.960 94.1 91.2 0.840
 C4MI 10.8 L3MI=3.416×C4MI+15.623 90.2 79.4 0.718
 SCMI 2.8 L3MI=10.978×SCMI+21.075 98.0 58.8 0.692
Female
 C2MI 8 L3MI=3.282×C2MI+12.498 87.1 72.8 0.460
 C3MI 6.3 L3MI=3.857×C3MI+14.644 48.4 90.7 0.616
 C4MI 9.5 L3MI=2.755×C4MI+12.730 87.0 60.5 0.649
 SCMI 1.5 L3MI=14.009×SCMI+18.381 93.5 100.0 0.668

C2MI–C4MI, normalized paravertebral skeletal muscle areas at the levels of second (C2), third (C3), and fourth (C4) cervical vertebrae values for stature; SCMI, normalized sum of the bilateral sternocleidomastoid muscle areas at the levels of C2, C3, and C4 vertebrae values for stature; L3MI, normalized sum of the all skeletal muscle area at the lower part of the third lumbar vertebrae (L3) level value for stature.

REFERENCES

1. Pressoir M, Desne S, Berchery D, Rossignol G, Poiree B, Meslier M, et al. Prevalence, risk factors and clinical implications of malnutrition in French Comprehensive Cancer Centres. Br J Cancer. 2010 Mar;102(6):966-71.
crossref pmid pmc pdf
2. Nishikawa D, Hanai N, Suzuki H, Koide Y, Beppu S, Hasegawa Y. The impact of skeletal muscle depletion on head and neck squamous cell carcinoma. ORL J Otorhinolaryngol Relat Spec. 2018 May;80(1):1-9.
crossref pmid
3. Martin L, Birdsell L, Macdonald N, Reiman T, Clandinin MT, McCargar LJ, et al. Cancer cachexia in the age of obesity: skeletal muscle depletion is a powerful prognostic factor, independent of body mass index. J Clin Oncol. 2013 Apr;31(12):1539-47.
crossref pmid
4. O’Brien S, Twomey M, Moloney F, Kavanagh RG, Carey BW, Power D, et al. Sarcopeni and post-operative morbidity and mortality in patients with gastric cancer. J Gastric Cancer. 2018 Sep;18(3):242-52.
crossref pmid pmc
5. Shirai H, Kaido T, Hamaguchi Y, Yao S, Kobayashi A, Okumura S, et al. Preoperative low muscle mass has a strong negative effect on pulmonary function in patients undergoing living donor liver transplantation. Nutrition. 2018 Jan;45:1-10.
crossref pmid
6. Ebadi M, Wang CW, Lai JC, Dasarathy S, Kappus MR, Dunn MA, et al. Poor performance of psoas muscle index for identification of patients with higher waitlist mortality risk in cirrhosis. J Cachexia Sarcopenia Muscle. 2018 Dec;9(6):1053-62.
crossref pmid pmc
7. Weijs PJ, Looijaard WG, Dekker IM, Stapel SN, Girbes AR, Oudemans-van Straaten HM, et al. Low skeletal muscle area is a risk factor for mortality in mechanically ventilated critically ill patients. Crit Care. 2014 Jan;18(2):R12.
crossref pmid pmc
8. Cruz-Jentoft AJ, Baeyens JP, Bauer JM, Boirie Y, Cederholm T, Landi F, et al. Sarcopenia: European consensus on definition and diagnosis: report of the European Working Group on Sarcopenia in Older People. Age Ageing. 2010 Jul;39(4):412-23.
crossref pmid pmc pdf
9. Prado CM, Lieffers JR, McCargar LJ, Reiman T, Sawyer MB, Martin L, et al. Prevalence and clinical implications of sarcopenic obesity in patients with solid tumours of the respiratory and gastrointestinal tracts: a population-based study. Lancet Oncol. 2008 Jul;9(7):629-35.
crossref pmid
10. Cooper C, Fielding R, Visser M, van Loon LJ, Rolland Y, Orwoll E, et al. Tools in the assessment of sarcopenia. Calcif Tissue Int. 2013 Sep;93(3):201-10.
crossref pmid pmc pdf
11. Mourtzakis M, Prado CM, Lieffers JR, Reiman T, McCargar LJ, Baracos VE. A practical and precise approach to quantification of body composition in cancer patients using computed tomography images acquired during routine care. Appl Physiol Nutr Metab. 2008 Oct;33(5):997-1006.
crossref pmid
12. Fearon K, Strasser F, Anker SD, Bosaeus I, Bruera E, Fainsinger RL, et al. Definition and classification of cancer cachexia: an international consensus. Lancet Oncol. 2011 May;12(5):489-95.
crossref pmid
13. Derstine BA, Holcombe SA, Goulson RL, Ross BE, Wang NC, Sullivan JA, et al. Quantifying sarcopenia reference values using lumbar and thoracic muscle areas in a healthy population. J Nutr Health Aging. 2018 Jan;22(1):180-5.
crossref pdf
14. Nemec U, Heidinger B, Sokas C, Chu L, Eisenberg RL. Diagnosing sarcopenia on thoracic computed tomography: quantitative assessment of skeletal muscle mass in patients undergoing transcatheter aortic valve replacement. Acad Radiol. 2017 Sep;24(9):1154-61.
crossref pmid
15. Kim EY, Kim YS, Park I, Ahn HK, Cho EK, Jeong YM, et al. Evaluation of sarcopenia in small-cell lung cancer patients by routine chest CT. Support Care Cancer. 2016 Nov;24(11):4721-6.
crossref pmid pdf
16. Derstine BA, Holcombe SA, Ross BE, Wang NC, Su GL, Wang SC. Skeletal muscle cutoff values for sarcopenia diagnosis using T10 to L5 measurements in a healthy US population. Sci Rep. 2018 Jul;8(1):11369.
crossref pmid pmc pdf
17. Shen W, Punyanitya M, Wang Z, Gallagher D, St-Onge MP, Albu J, et al. Total body skeletal muscle and adipose tissue volumes: estimation from a single abdominal cross-sectional image. J Appl Physiol. 2004 Dec;97(6):2333-8.
crossref pmid
18. Swartz JE, Pothen AJ, Wegner I, Smid EJ, Swart KM, de Bree R, et al. Feasibility of using head and neck CT imaging to assess skeletal muscle mass in head and neck cancer patients. Oral Oncol. 2016 Nov;62:28-33.
crossref pmid
19. Oken MM, Creech RH, Tormey DC, Horton J, Davis TE, McFadden ET, et al. Toxicity and response criteria of the Eastern Cooperative Oncology Group. Am J Clin Oncol. 1982 Dec;5(6):649-55.
crossref pmid
20. Wendrich AW, Swartz JE, Bril SI, Wegner I, de Graeff A, Smid EJ, et al. Low skeletal muscle mass is a predictive factor for chemotherapy dose-limiting toxicity in patients with locally advanced head and neck cancer. Oral Oncol. 2017 Aug;71:26-33.
crossref pmid
21. Sanderson RJ, Ironside JA. Squamous cell carcinomas of the head and neck. BMJ. 2002 Oct;325(7368):822-7.
crossref pmid pmc
TOOLS
Download PDF File  Download PDF File
PubReader  PubReader
ePub Link  ePub Link
XML Download  XML Download
Full text via DOI  Full text via DOI
Download Citation  Download Citation
  Print
Share:      
METRICS
39
Web of Science
43
Crossref
43
Scopus
7,916
View
308
Download
Related article
Editorial Office
Korean Society of Otorhinolaryngology-Head and Neck Surgery
103-307 Park Tower officetel, Yongsan-dong 5-ga, Yongsan-gu, Seoul 04385, Korea
TEL: +82-2-711-9091   FAX: +82-2-3487-6603   E-mail: editor.eceo@gmail.com
Copyright © Korean Society of Otorhinolaryngology-Head and Neck Surgery.                 Developed in M2PI
Close layer
prev next