Is Body Mass Index Associated With the Development of Age-Related Hearing Impairment in Koreans? The Korean National Health and Nutrition Examination Survey 2009–2012
Article information
Abstract
Objectives
The aim of this study was to evaluate whether body mass index (BMI) is associated with age-related hearing loss (ARHL) in the Asian elderly population.
Methods
Data from the Korean National Health and Nutrition Examination Survey 2009–2012 were used for the analyses. The pure tones at 0.5 and 1 kHz of both ears of each subject were averaged to obtain the low-frequency, those at 2 and 3 kHz were averaged to obtain the mid-frequency, and those at 4 and 6 kHz were averaged to obtain the high-frequency. The average hearing threshold (AHT) was calculated as pure tone average at 4 frequencies in the better ear. ARHL was defined as the AHT >25 dB.
Results
Univariate analyses revealed an increase in the BMI tertile in men was associated with a decreased low-frequency threshold, while an increase in the BMI tertile in women was associated with decreased mid- and high-frequency thresholds. Multivariate analyses adjusted for confounders show no significant differences in low-, mid-, or high-frequency. There was no significant difference in the prevalence of ARHL by BMI tertiles. Linear regression analyses show no association between BMI and low-, mid-, and high-frequency or AHTs. The area under the receiver operating characteristic curve values for AHT was 0.515 in men and 0.522 in women. The logistic regression analyses showed no association between BMI and ARHL in either sex.
Conclusion
BMI is not advantageous for the prediction of ARHL. In future epidemiological studies, BMI as a covariate of obesity may be replaced by other active metabolic parameters that have better predictive ability of ARHL than BMI.
INTRODUCTION
The prevalence of age-related hearing loss (ARHL) gradually increases as the general population ages. ARHL is caused by a number of multifactorial processes such as ototoxic agents, trauma, metabolic disturbances, diet, and hormonal changes [1-3]. Metabolic diseases, such as diabetes mellitus (DM) and hypertension (HTN), are associated with vasculopathies in the stria vascularis of the cochlear duct [4].
Metabolic diseases such as DM, HTN, and dyslipidemia are correlated with obesity. Obesity is measured by body mass index (BMI), waist circumference, or body composition analysis using bioelectrical impedance analysis or dual X-ray absorptiometry. Among these indicators, BMI is most commonly used to assess obesity and is obtained by dividing a person’s total body weight in kilograms by the square of their height in meters.
The relationship between BMI and ARHL is controversial. Some studies have shown that BMI is associated with hearing loss in both sexes, while other studies have indicated that BMI is associated with hearing loss in only women [5,6]. One large study has shown an association between BMI and hearing loss; however, the hearing loss data in this study were gathered by hearing questionnaires [7]. Other studies show no association between BMI and hearing loss [8,9]. However, many investigators think that BMI is a definite risk factor of ARHL and they include BMI as a covariate in epidemiologic studies. The aim of this study was to evaluate whether BMI is associated with ARHL in the Asian elderly population.
MATERIALS AND METHODS
Study population
Data from the Korean National Health and Nutrition Examination Survey (KNHANES) 2009–2012 were used for the analyses. The KNHANES is a nationwide, multistage, stratified survey of a representative sample of the South Korean population conducted by the Korea Centers for Disease Control and Prevention. The total number of participants in KNHANES was 36,067 (Fig. 1). Data were excluded for the present analyses if the subjects were younger than 65 years of age (n=21,050); they could not provide data regarding BMI (n=4,557) and hearing evaluation (n=4,583); they had external or middle ear disease (n=836); they had brain disorders such as stroke (n=1,330). Any subjects with asymmetric hearing results were also excluded (n=614). More than a 15-dB difference at 0.5, 1, 2, or 4 kHz was defined as asymmetric hearing. As a result, 3,097 participants were included in this study. Local ethical committee approval was obtained for this study.
Flow chart of the study participants. BMI, body mass index.
Study variables
Clinical and laboratory data collected from the participants during the health examination included the following: age (yr), sex, BMI (kg/m2), hemoglobin (g/dL), serum creatinine (mg/dL), total cholesterol (mg/dL), high-density lipoprotein cholesterol (mg/dL), triglyceride level (mg/dL), smoking behavior, and alcohol consumption.
BMI was calculated by dividing the total body weight in kilograms by the square of the participant’s height (kg/m2). Participants were divided into 3 groups according to their BMI tertiles: the low tertile (<21.9 kg/m2 for men and <22.8 kg/m2 for women); the middle tertile (21.9–24.5 kg/m2 for men and 22.8–25.6 kg/m2 for women); the high tetile (>24.6 kg/m2 for men and >25.6 kg/m2 for women). We also analyzed the data using an age-based classification (65–69, 70–79, ≥80 years), because BMI has been reported to decrease with the age [10].
DM was defined as a self-reported history of a DM diagnosis or a fasting glucose level of ≥126 mg/dL. HTN was defined as an a systolic blood pressure of ≥140 mmHg, diastolic blood pressure of ≥90 mmHg, a self-reported history of HTN, or the use of anti-HTN drugs. Smoking behaviors were classified as current smoker, ex-smoker, or nonsmoker. The mean daily alcohol intake was defined by the Korean version of “standard drinking,” which was based on the World Health Organization classification [11,12]. We classified the mean daily alcohol intake into 3 categories: abstinence (not having had an alcohol drink within the last year); moderate drinking (women, 0.1–19.99 g pure alcohol/day; men, 0.1–39.99 g pure alcohol/day), and heavy drinking (women, ≥20 g pure alcohol/day; men, ≥40 g pure alcohol/day).
Otological physical examinations and pure tone audiometry were performed as previously described [13]. None of these subjects were currently receiving medication that is associated with ototoxicity. Histories of explosive or occupational noise exposure were classified as positive or negative, according to the subjects’ recall. An explosive noise was defined as a sudden loud noise, such as an explosion or gunshot. Exposure to occupational noise was determined according to whether the participants had worked in a location with loud machinery for ≥3 months. Loud noise was defined by whether the participants had needed to raise his or her voice to have a conversation. The hearing thresholds were measured at 0.5, 1, 2, 3, 4, and 6 kHz. For both ears of each subject, the pure tone averages at 0.5 and 1 kHz were averaged to obtain the low-frequency value, those at 2 and 3 kHz were averaged to obtain the mid-frequency value, and those at 4 and 6 kHz were averaged to obtain the high-frequency value. In the present study, the average hearing threshold (AHT) was calculated as pure tone average at 4 frequencies (0.5, 1, 2, and 4 kHz). ARHL was defined by AHT>25 dB in the better ear.
Statistical analyses
The data were analyzed using IBM SPSS Statistics ver. 20.0 (IBM Co., Armonk, NY, USA). The variables were expressed as mean±standard deviation and compared using t-tests. Categorical variables were expressed as counts and percentages. The Pearson chi-square test or the Fisher exact test was used to analyze categorical variables. For continuous variables, means were compared using the t-test or one-way analysis of variance, followed by a post hoc Tukey comparison. A correlation analysis was performed to assess the strength of the correlation between BMI and hearing threshold. Multivariate analyses using analyses of covariance, multiple linear regression, or multiple logistic regression were used determine the independent predictors of hearing thresholds or ARHL. Model 1 was unadjusted; model 2 was adjusted for age; model 3 was adjusted for age, smoking, mean daily alcohol intake, DM, HTN, exposure to explosive noise, and exposure to occupational noise. The data for linear regression analyses were expressed as mean±SE. Discrimination, which is the ability of the model to differentiate between participants who have ARHL and those who do not, was examined using the area under the receiver operating characteristic curve (AUROC). AUROC analysis was also performed to calculate cutoff values, sensitivity, and specificity. The best cutoff risk point was defined from the maximum of the Youden index in the AUROC. The AUROC was calculated by using MedCalc ver. 11.6.1.0 (MedCalc, Mariakerke, Belgium). The level of statistical significance was set at P<0.05.
RESULTS
Clinical characteristics of participants
The mean age of the study participants decreased as the BMI tertile increased in both sexes (Table 1). The prevalence of DM and HTN increased the BMI tertile increased in both sexes. Current smoking in both sexes and AHT in women were associated with a high BMI tertile. There were no significant differences in exposure to occupational noise or explosive noise according to BMI tertiles in both sexes. The prevalence of ARHL was not associated with BMI tertile in either sex.

Clinical characteristics of participants
Association between BMI and hearing thresholds
In men, the low-frequency value decreased as BMI tertile increased (Fig. 2). There was a significant decrease in the low-frequency value of the high BMI tertile compared with the low BMI tertile. In women, the mid-frequency and high-frequency values decreased as BMI tertile increased. There were significant decreases in the mid-frequency and high-frequency values of the high BMI tertile compared with the low BMI tertile. However, multivariate analyses show no association between BMI tertile and the low-, mid-, or high-frequency values (Table 2).
Hearing thresholds according to body mass index tertile. Low-Freq trend, P=0.021 in men and P=0.092 in women; Mid-Freq trend, P=0.467 in men and P=0.006 in women; High-Freq trend, P=0.412 in men and P=0.002 in women. Freq, frequency. *P<0.05 compared to participants in the low tertile.
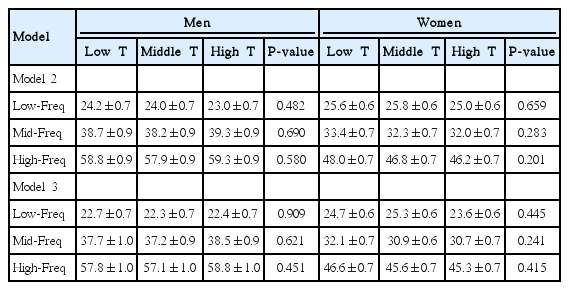
Multivariate analyses of hearing thresholds by body mass index tertile
In men, correlation coefficients between BMI and hearing thresholds were –0.046 for low-frequency, –0.020 for mid-frequency, –0.030 for high-frequency, and –0.034 for AHT values.
There were no significant correlations between BMI and hearing thresholds (P=0.092 for low-frequency, P=0.446 for mid-frequency, P=0.278 for high-frequency, and P=0.211 for AHT). In women, the correlation coefficients between BMI and hearing thresholds were –0.057 for low-frequency, –0.093 for mid-frequency, –0.108 for high-frequency, and –0.073 for AHT values. Although there were significant correlations between BMI and hearing thresholds, the correlations were weak (P=0.016 for low-frequency, P<0.001 for mid-frequency, P<0.001 for high-frequency, and P=0.002 for AHT). Multiple linear regression analyses show no significant association between BMI and hearing threshold (Table 3).
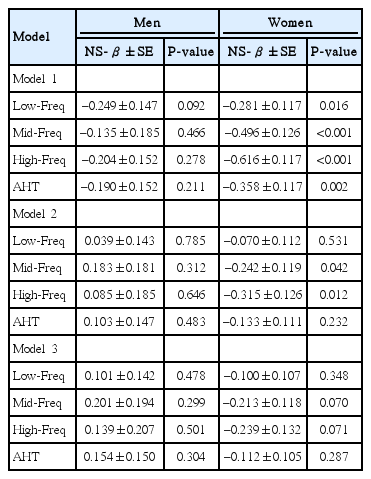
Multiple linear regression analysis using body mass index for predicting hearing thresholds
Association between BMI and ARHL
The AUROCs for ARHL were analyzed for each participant. For the men, the AUROC value for ARHL was 0.515 (95% confidence interval [CI], 0.488–0.543) for BMI (P=0.335). The cutoff value was ≤20.7 kg/m2. The sensitivity and specificity for predicting ARHL were 21.2% and 84.0%, respectively. For the women, the AUROC value for ARHL was 0.522 (95% CI, 0.498–0.545) for BMI (P=0.114). The cutoff value was ≤21.2 kg/m2. The sensitivity and specificity for predicting ARHL were 19.1% and 87.1%, respectively.
Unadjusted logistic regression showed that men in the middle and high tertiles had a 1.013- and 0.912-fold increased risk of ARHL compared with participants in the low tertile (Table 4). Women in the middle and high tertiles had a 0.867- and 0.916-fold increased risk of ARHL compared with participants in the low tertile. There were no significant differences in the odds ratios in the middle and high tertiles compared with that in the low tertile for either sex. In addition, multivariate logistic regression analyses were adjusted for age, mean daily alcohol intake, smoking, DM, HTN, exposure to explosive noise, and exposure to occupational noise. Despite this adjustment, there were no significant associations between ARHL and BMI tertile.

Odds ratio for age-related hearing loss by body mass index tertile
Subgroup analyses according to age
The age decreased with an increase in the BMI tertile. We divided both male and female participants into 3 groups according to age (65–69, 70–79, and ≥80 years). The 65–69, 70–79, and ≥80-year-old groups had 501, 741, and 82 men; and 647, 956, and 170 women; respectively. The mean BMI in the 65–69, 70–79, and ≥80-year-old groups in men was 23.8±2.8, 23.0±3.0, and 22.5±2.6 kg/m2, respectively; and the same in women was 24.6±3.0, 24.4±3.4, and 23.2±3.1 kg/m2, respectively (Fig. 3). In men, the BMI in the 65–69 years old group was higher than that in the other age groups. In women, the BMI in the ≥80-year-old group was lower than that in the other age groups. In the men, the AUROC for ARHL was 0.537 (95% CI, 0.492–0.581), 0.517 (95% CI, 0.480–0.553), and 0.569 (95% CI, 0.454–0.678) for the BMI in the 65–69, 70–79, ≥80 years old participants, respectively (P=0.153, P=0.439, and P=0.378, respectively). In the women, the AUROC for ARHL was 0.524 (95% CI, 0.485–0.563), 0.524 (95% CI, 0.492–0.556), and 0.551 (95% CI, 0.473–0.627) for the BMI in the 65–69, 70–79, ≥80 years old participants, respectively (P=0.334, P=0.193, and P=0.355, respectively).

Body mass index according to age. *P<0.05 versus body mass index in the 70–79 or ≥80 years old participants. †P<0.05 versus body mass index in the 65–69 or 70–79 years old participants.
An unadjusted logistic regression showed that, in men, the odd ratios for hearing loss by 1-kg/m2 increase in BMI were 1.046 (95% CI, 0.981–1.115), 0.987 (95% CI, 0.939–1.037), and 0.890 (95% CI, 0.703–1.125) in the 65–69, 70–79, and ≥80 years old participants, respectively (P=0.167, P=0.599, and P=0.329, respectively). In women, the odd ratios for hearing loss by 1-kg/m2 increase in BMI were 1.022 (95% CI, 0.968–1.079), 0.979 (95% CI, 0.942–1.016), and 1.064 (95% CI, 0.935–1.211) in the 65–69, 70–79, and ≥80 years old participants, respectively (P=0.438, P=0.263, and P=0.346, respectively). Finally, multivariate analyses also showed no significant associations between ARHL and BMI in the 3 age-based groups for either sex.
DISCUSSION
The present study focused on the association between ARHL and BMI. The prevalence of ARHL was not associated with BMI tertile in either sex. Linear regression analyses showed no association between BMI and hearing thresholds, while logistic regression analyses showed no association between BMI tertile and ARHL.
Previous studies showed an association between obesity and ARHL [5,14,15]. The amount or distribution of fat mass induces metabolic disturbances while muscle mass protects from metabolic disturbances [16-18]. Clinical obesity mainly means increase in fat tissue. Fat tissue induces an underproduction of adiponectin, consequently decreasing adiponectin, which may be associated with the development of ARHL [19-22]. BMI is a classic indicator for obesity. However, BMI cannot distinguish between fat and muscle mass, and cannot evaluate the distribution of fat mass.
Some studies have shown that BMI is positively associated with the development of ARHL [5-7,9,23]. This hypothesis is based on the belief that the hearing threshold is associated with vasculopathies in the metabolic problem and that BMI is an important marker for metabolic diseases [4]. Therefore, the increase in BMI may be related to hearing impairment. However, some studies have suggested that BMI is not an optimal marker for predicting metabolic diseases [24-26]. Obese individuals can be divided into 2 categories: the metabolically healthy obese and the metabolically unhealthy obese. In addition, individuals with normal BMI can have metabolic problems. Wildman et al. [25] showed that there is a high prevalence of metabolic abnormalities in individuals with a normal BMI or obese individuals who are metabolically healthy. BMI cannot differentiate between individuals with metabolically healthy obesity or with a normal BMI and a high metabolic risk.
Previous studies had some limitations. Some studies demonstrated the association between 2 variables in only women [7,23]. Other studies defined the high BMI group as participants with a very high BMI level (>95th percentile) or they did not show the association between 2 variables in high frequency [6,23]. A large cohort study that enrolled 68,421 participants showed an association between ARHL and BMI, but the hearing threshold was evaluated by questionnaire. The present study enrolled a large number of participants, and the participants were divided into 3 groups according to their BMI level. The ARHL was evaluated using pure tone audiometry, and the patients with congenital or acquired abnormalities were excluded using comprehensive ear examinations.
In the present study, univariate analysis showed no association between the prevalence of ARHL and BMI tertile in either sex. We analyzed the associations between BMI and hearing thresholds as continuous variables (low-, mid-, high-frequency, or AHT) and ARHL as a categorical variable. There were no significant associations in these analyses. Although the low-frequency value in men and the mid- and high-frequency values in women decreased as BMI tertile increased, the multivariate analyses adjusted for age showed no significant association between BMI tertile and these values in either sex. The AUROC values for ARHL were 0.515 for men and 0.522 for women. BMI did not have a significant value for predicting ARHL and the AUROC values were very small. The sensitivity was low in both sexes. Therefore, the use of BMI as a covariate may be unnecessary for the correction of metabolic disturbances for ARHL, and BMI may be replaced by other metabolically active parameters such as fat mass index, waist circumference, or visceral fat area.
There were some issues regarding the association between BMI and age. BMI is a risk factor for mortality [27]. Increasing age is associated with decrease in muscle mass, and the elderly population with a high baseline BMI is under risk of mortality. Therefore, reference BMI in the elderly population is different from that in the nonelderly population. A previous report showed that the mean BMI in the 65–69, 70–79, and ≥80 years old elderly population was 29.5, 28.8, and 27.2 kg/m2, respectively, in men; and 29.6, 29.5, and 26.7 kg/m2, respectively, in women [10]. These contradicting results regarding the association between BMI and HL may be associated with different age criteria. This issue also reveals the difficulty in applying the same criteria for elderly and nonelderly populations. Therefore, we tried to decrease the effect of age in our study. Our data showed a difference in the baseline BMI by age, but the subgroup analysis according age also showed no association between BMI and ARHL in the 3 age-based groups for either sex.
Our study enrolled participants from a wide age range and from both sexes. The baseline BMI is different according to sex or age, and the association may be different according to participants’ age or sex. Therefore, we tried to decrease these biases by dividing the participants into groups by sex or age. We found no association between BMI and HL using various statistical methods or hearing indicators (i.e., hearing thresholds as continuous variable and hearing loss as a categorical variable). We think that these subgroup analyses and various statistical methods are useful to identify the nonassociation between 2 variables.
Some authors have evaluated the association between hearing thresholds and metabolic parameters other than BMI. Kim et al. [28] investigated the association between visceral fat area measured using computed tomography and hearing threshold. Kang et al. [29] showed an association between metabolic syndrome and hearing thresholds. Their study also showed that each metabolic syndrome or insulin resistance component was associated with hearing thresholds. Hwang et al. [8] showed that waist circumference as a marker of central obesity is an independent risk factor of ARHL and that waist circumference was more important than BMI as a risk factor of ARHL. In addition, a prospective study demonstrated that waist circumference was associated with hearing impairment in subjects aged 48–92 years [30]. BMI may be replaced with the aforementioned parameters, but further investigations will be needed to determine whether they are superior to BMI.
There were a few limitations in this study. First, the study was limited by its cross sectional nature. Second, the present study included an ethnically homogenous population. Third, this study did not evaluate sensitive components of hearing problems such as speech discrimination. Further prospective analysis, including follow-up data and speech discrimination, will be needed to evaluate a possible strong correlation between the 2 variables.
In conclusion, BMI is not advantageous for the prediction of ARHL. In future epidemiological studies, BMI as a covariate of obesity may be replaced by other active metabolic parameters that have better predictive ability of ARHL than BMI.
Notes
No potential conflict of interest relevant to this article was reported.
Acknowledgements
This research was supported by Basic Science Research Program through the National Research Foundation of Korea (NRF) funded by the Ministry of Science, ICT & Future Planning (2014R1A1A3049993).