

INTRODUCTION
Understanding and applying masking are very important in audiology. The concept of central masking is especially hard to understand when psychophysical tests are performed. Its neurophysiological basis must consist of more than the confusion or interference between binaural signals.
Central masking occurs when a test signal is presented to one ear and a masking sound to the other ear. It is one of the binaural interactions of the central auditory system and one of the variables involved in determining the correct threshold of psychoacoustic measures [1]. It differs from peripheral masking or over-masking, which results from interaural crossover of the sound. Other examples of binaural interactions are comodulation masking release, informational masking, and binaural masking (level difference).
The classic data and theory of central masking were provided by Zwislocki [2], who observed a 3-18 dB threshold shift for a gated pure tone signal in one ear when a gated pure tone masker was presented via insert earphones to the other ear. Central masking is maximal when the masking sound is presented in bursts and the threshold is determined at the onset of the bursts. The threshold shift decreases rapidly with the time delay and also as the frequency difference between the test and masking sound increases [3].
Central masking probably results from binaural interactions that are possible at various levels of the central auditory system, including the inferior colliculus (IC), medial geniculate bodies, and corpus callosum. Several studies have investigated this effect electrophysiologically in the medial olivocochlear system of guinea pigs [4] or using otoacoustic emission in humans [5]. These reports use the term "contralateral suppression" instead of "central masking" because the efferent physiological suppression effects are related to the psychophysical central masking threshold shifts at the medial superior olivary level. Several studies have investigated central masking at the IC level in the guinea pig [6] and in human patients with a unilateral lesion of the IC [7]. At the level of the auditory cortex, the contralateral masking effect has been studied in the cat [8] and in humans with brain lesions using dichotic speech perception [9]. Whether previous studies were psychoacoustic studies involving human recordings of evoked potentials or otoacoustic emission, or electrophysiological neural recordings of various levels in animals, the common feature of central masking is its contralateral inhibitory effect on the excitatory input of one ear.
The aim of this work was to investigate the electric-acoustic interactions in the IC of guinea pigs and to observe how central masking appears in invasive neural recordings. An invasive procedure for neural recordings was ultimately required to ascertain the neuronal basis of this phenomenon, which has been reported in previous studies with gross evoked potentials. The thin-film, penetrating, multisite recording arrays used in this study were positioned within the central nucleus of the IC to record the multiunit activity [10] and near-field potentials [11]. We expected that the recordings within the IC would help us to understand the data for the far-field potentials and the psychoacoustic results.
MATERIALS AND METHODS
Animal preparation
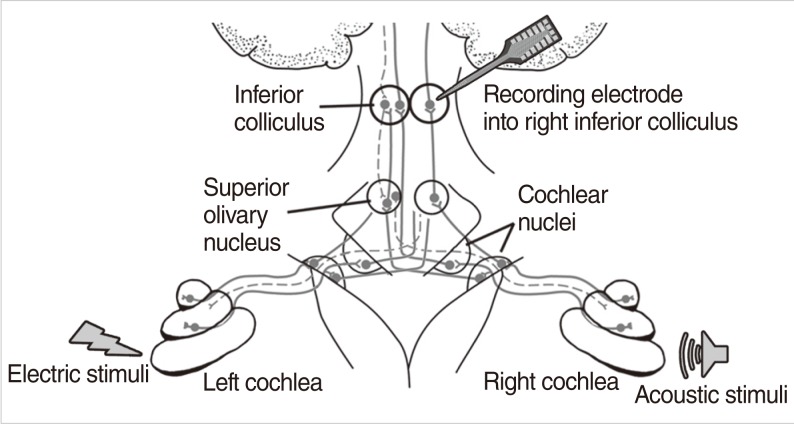
Recordings were made in 15 adult guinea pigs (body weight range, 430 to 920 g). The animals were divided into two groups according to experimental goals. Six animals were enrolled to experiment for electric-acoustic interactions using electric pulse train and acoustic noise stimuli. Nine animals were enrolled to experiment for both acoustic-acoustic and electric-acoustic interactions using electric pulse train and click sound stimuli and both click sound stimuli with different time delays. Schematic setting of electric and acoustic stimuli as well as IC recording was shown in Fig. 1.
Anesthesia
Anesthesia was induced by intramuscular injection of a combination of ketamine (40 mg/kg), xylazine (10 mg/kg), and acepromazine (1 mg/kg). A single dose of atropine sulfate (0.05 mg/kg) was given subcutaneously to reduce mucosal secretion. The right external jugular vein was exposed surgically and a catheter was inserted to provide a route for continuous hydration with Ringer's solution. The animal was then tracheotomized and connected to a ventilator (Harvard Apparatus model 665 Single Animal Ventilator) with an oxygen supply (tidal volume, 5 mL; respiratory rate, 50 cycles per minute). Partial pressure of expired CO2 was monitored with a capnometer (Capnocheck BCI 9004, Smiths Medical ASD Inc., Dublin, OH, USA) and maintained at 25-35 mmHg throughout the experiments. Core temperature, heart rate and blood oxygen saturation were monitored with a vital signs monitor (Pace Tech model 4000B; Pace Tech Inc., Clearwater, FL, USA). Core temperature was maintained at 38┬▒1Ōäā with a circulating water heating pad and drapes. The effectiveness of anesthesia was assessed every 30 minutes using a paw-pinch reflex and additional anesthetic (ketamine, 20-40 mg/kg; xylazine, 3.8-7.5 mg/kg; acepromazine, 0.38-0.75 mg/kg) was given intramuscularly if needed.
Surgical preparation: insertion of an electrode via left cochleostomy
The animal's head was immobilized by a custom-designed head holder. Before the cochleostomy, initial click-evoked compound action potential (CAP) threshold was checked to assess the acoustic sensitivity of each ear. After the skin incision was made on midline and left bullectomy was performed using cutting burr, the left cochlea was surgically accessed and a cochleostomy was made posterior to the round window using a 30 gauge needle and a rotary motion.
A platinum/iridium (90/10%) wire was inserted to a depth no greater than 1 mm through the cochleostomy and into the basal aspect of the scala tympani to provide a minimally invasive monopolar electrode for intracochlear stimulation of electric pulse train. Careful insertion of this electrode provides for a preparation with acoustic sensitivity (as assessed by the click-evoked CAP maintained to within 20 dB of that measured prior to the cochleostomy. Only preparations with this degree of sensitivity or better were accepted for subsequent electrophysiological data collection.
Surgical preparation: exposure of right inferior colliculus
To expose right IC, previously-made skin incisions were extended rostrally and then laterally toward the jugular processes on both sides. Skin flaps were retracted to expose the posterior aspect of the skull. Superior portions of right parietal and occipital bones were thinned using a diamond burr from 5 mm posterior to the coronal suture and then removed by a rongeur to expose the dura, exposing the sagittal and transverse sinuses. After the dura was opened, superficial brain vessels were cauterized with bipolar cautery. The posterior portion of the occipital lobe of the cerebrum was aspirated to expose the right IC, which could be partially visualized, lying between the superior colliculus and cerebellum.
Stimulus generation and parameter
Acoustic stimuli were digitally generated by a 16-bit digital-to-analog converter (100,000 samples/s), and controlled by custom-written software using the LabView programming environment (National Instruments, Austin, TX, USA). Acoustic click stimuli were generated with 100 ┬Ąs/phase biphasic electric pulses and presented to the ears with an inter-stimulus interval of 30 ms by a BeyerDynamics DT48 earphone (BeyerDynamics, Heilbronn, Germany) coupled to an ear speculum. Acoustic click sounds of 100 ┬Ąs/phase were chosen because the earphone responses tended to decrease significantly above 10 kHz.
Bursts of broadband noise were generated by a noise generator (Grason-Stadler model 455C, Grason-Stadler Ltd., W. Concord, MA, USA). The noise was gated by a Wilsonics electronic switch (Wilsonics BSIT, San Diego, CA, USA) with a rise-fall time of 1 ms, and presented to the ear with a total duration of 100 ms. Overall noise level was between 43 to 83 dB SPL. The generator output was fed to an attenuator, an impedance-matching transformer and BeyerDynamics DT48 earphone coupled to an ear speculum. Overall sound levels were computed by accounting for the system frequency responses. Sound pressure in the ear canal was monitored during each experiment using a probe tube-1/4 inch condenser microphone system coupled to the speculum to calibrate the acoustic levels in individual subjects. The noise was presented 50 ms after the onset of the electric pulse train. This was done to avoid the large transient effect due to short-term adaptation of the IC responses to the electric pulse train.
Electric pulse train stimuli were 40 ┬Ąs/phase biphasic pulses and fed into the left ear through an isolated current source that was optically isolated from its input and capacitively coupled to the stimulating electrode. The short duration of 40 ┬Ąs/phase was suitable because it limited the duration of the stimulus artifact for measurement of short-latency responses and was similar to that generally in clinical use. The output of the current source was monitored with an oscilloscope through an optically isolated pathway. This electric stimulus was presented in 400 ms pulse trains and silent inter-train interval of 900-1,200 ms.
Recording and response analysis
For auditory brainstem response (ABR) recordings to measure the hearing threshold of each subject, the positive and negative needle recording electrodes were inserted subdermally along the midline at the vertex (5 mm rostral to the bregma) and at the nuchal ridge, respectively. A needle electrode was inserted into the neck muscle as an amplifier ground. The evoked potentials were amplified with a gain of 1,000 and low-pass filtered with a cut-off frequency of 30 kHz. The average was taken from 1,000 sweeps.
For multi-site recording along the tonotopic gradient of the central nucleus of the IC, a "5 mm 100 ┬Ąm" single-shank, thin-film, penetrating recording probe, manufactured by the University of Michigan, Center of Neural Communications Technology (now available from NeuroNexus Technologies, http://www.neuronexustech.com/) was used. The probe of 5 mm length had 16 recording sites (400 ┬Ąm2) arranged linearly with 100 ┬Ąm center-to-center spacing. This probe was the same one that has been used by the University of California, San Francisco group [10]. The probe was inserted perpendicularly to the surface of the IC in the coronal plane at an angle of 30-40┬░ off the parasagittal plane. This trajectory of the probe could make the probe traverse the central nucleus with a trajectory approximately orthogonal to its iso-frequency laminae [13]. The depth of inserted probe tip was kept to be 2.0-2.5 mm.
Multi-unit activity in the IC was recorded with above 16-site probe that was buffered by a custom-built 16-channel unit-gain headstage. Recorded potentials were amplified by 100 times, low-pass filtered using fourth-order Bessel filters with a 3 dB cut-off frequency of 15 kHz and sampled at 25,000 samples/s/channel. LabView allowed for recording of 8 channels simultaneously using time-division multiplexing. Fifty sweeps were done for each stimulus condition. Responses to each stimulus presentation were saved for later off-line analysis. In this study, we reported only data obtained from 8 of the 16 probe sites (i.e., every other electrode along the linear array).
After the insertion of the recording electrode array into the central nucleus of the IC, it was checked whether it was inserted appropriately. While tone-burst stimuli were presented, the range of maximum response across electrodes within the recording array (maximum spike activity) was checked for each test frequency. The depth of the recording electrode was adjusted if necessary, trying to obtain a range of best frequencies across the recording electrode array to cover a frequency range of 1-16 kHz. We chose the depth of the electrode array that resulted in the best maximum response of the frequencies that spanned the ranges of 0.5 to 20 kHz (J05, J06, J07, J08, J10, J12), 1 to 16 kHz (J23, J26, J27, J30) or 1 to 20 kHz (J28, J32, J33), 2 to 20 kHz (J19), and 4 to 10 kHz (J20) (measuring superficial to deep).
After then, the responses to binaural click acoustic stimuli (delivered to both ears) were assessed. Sound intensities were selected to ensure that acoustic crossover (sound presented to one ear stimulating the other ear) did not influence the binaural interaction effects. Inter-aural attenuation of an acoustic click (as assessed by click-evoked ABR) has been known to be at least 50 dB for stimulation of guinea pigs with a closed acoustic system [14].
Following the acoustic-acoustic measures, electric-acoustic measure was performed using the intracochlear monopolar electrode (platinum-iridium wire) to stimulate the auditory nerve of the left cochlea. The baseline IC measures to obtain growth functions of each stimulus levels, through this, with stimuli adjusted to produce equal monaural response amplitudes, adequate and comparable stimulus levels were chosen. We assumed that a delay of electric stimulus would be needed in the electric-acoustic stimulation because the electric stimulation of the auditory nerve tends to have shorter latencies than the acoustic stimulus [15]. Therefore, the onset of the left electric stimulus was delayed by 0.5 ms or longer (1.0, 2.0, and 3.0 ms) to assess the binaural interaction as a function of the time delay.
The click-evoked ABR thresholds were determined before and after placement of the stimulating electrode in the cochlea to assess the possible threshold change induced by the cochleostomy. In all cases, upward acoustic threshold shifts were less than 20 dB SPL. Stimulation and recording were performed in a double-walled sound booth.
Data analyses
Signal averaging techniques to extract the field potential and to attenuate the neural spikes were performed using custom-designed software written in the MATLAB ver. 6.5 (MathWorks, Natick, MA, USA). The signal averaging was done by adding all raw waveforms that contained both field potentials and neural spikes. The average waveform was computed both across sweeps and across the 8 recording electrodes so as to obtain an overall response analogous to more far-field (i.e., ABR) measures.
The total spike numbers were counted measured for a range of delays. The neural spikes were sorted out after removing the field potentials by averaged wave were subtracted out. This analysis was also done by custom-designed software written in the MATLAB program. The recorded traces were first digitally high-pass filtered. Then, to remove electric artifact, templates of the electric stimulus artifacts were computed, based on the response traces with no apparent recorded action potential. Those templates were then subtracted from each individual trace and the spike criterion amplitude was determined on the basis of examining distributions of "events" automatically picked within a selected window. Spike amplitude and latency were then determined and histograms of the responses (based on the aforementioned analysis criteria) were computed. The initial analyses of the data have not attempted to separate individual cells in what could be multi-unit activity from a single recording electrode. Thus, spike counts represent total activity recorded at each site.
RESULTS
Both field potentials and unit activity were evident in the response to electric pulses and to acoustic clicks within each sweep. The individual action potentials, which had significant temporal variability, were deemphasized in the averaged waveforms. After the averaged waveforms were obtained, they were used to subtract the field potential to reveal the neural spikes.
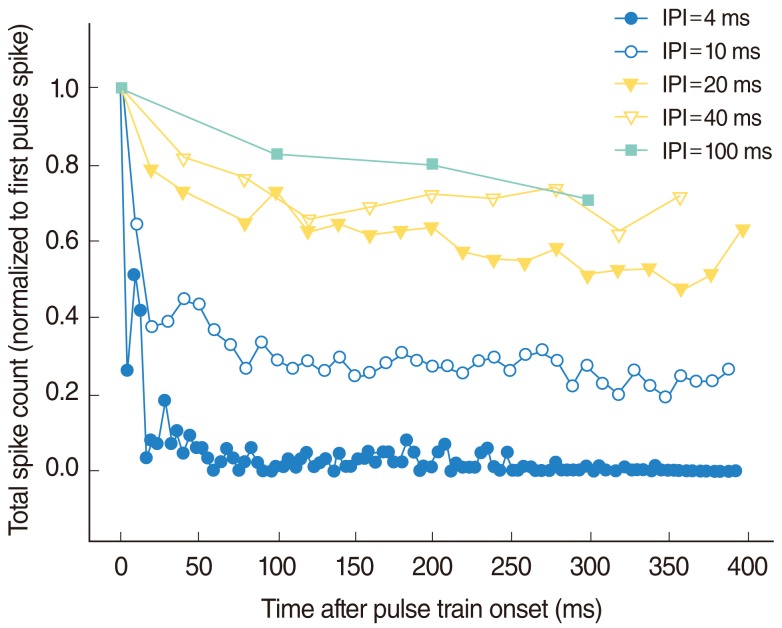
In this study, the electric pulse train stimuli tended to make more adaptation of the IC responses, compared with those typically seen in either deafened or acoustically sensitive auditory nerves [16, 17]. This is consistent with data from deafened feline preparations, which demonstrated relatively strong adaptation in the IC [18]. Therefore, the interpulse interval (IPI), defined as the time between the onset of adjacent pulses, was modified systematically from 4 to 100 ms to assess the effects of the stimulus rate on the adaptation of the IC response. Fig. 2 shows the adaptation pattern of the IC unit response that was observed in this study as a function of the IPI of the electric pulse train stimuli. An IPI of 10-20 ms was suitable because it prevented the adaptation to the electric stimulus dominating any possible acoustic-electric interactions, whereas it still provided a reasonable temporal resolution with which to evaluate the changes in the IC response during the electric pulse train stimuli.
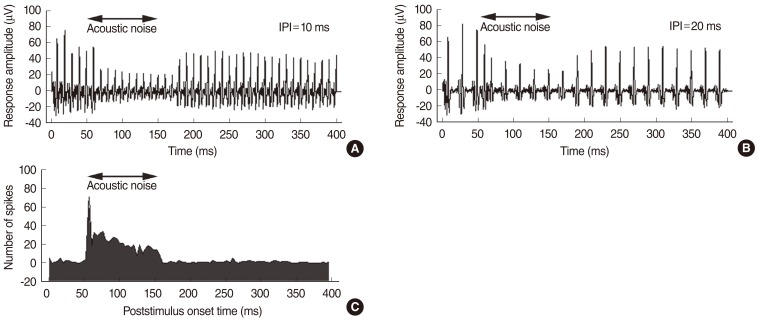
Fig. 3 shows plots of the averaged evoked responses to electric pulse trains presented to the left ear together with acoustic noise. The stimulus was an electric pulse train with a total duration of 400 ms and a level of 0.6 mA. Acoustic noise of 63 dB SPL was presented to the left ear in the 50-150 ms interval after the onset of the electric stimulus. The response amplitude of the electric pulse train stimuli decreased markedly when the acoustic noise was presented ipsilateral to the electric stimulus.
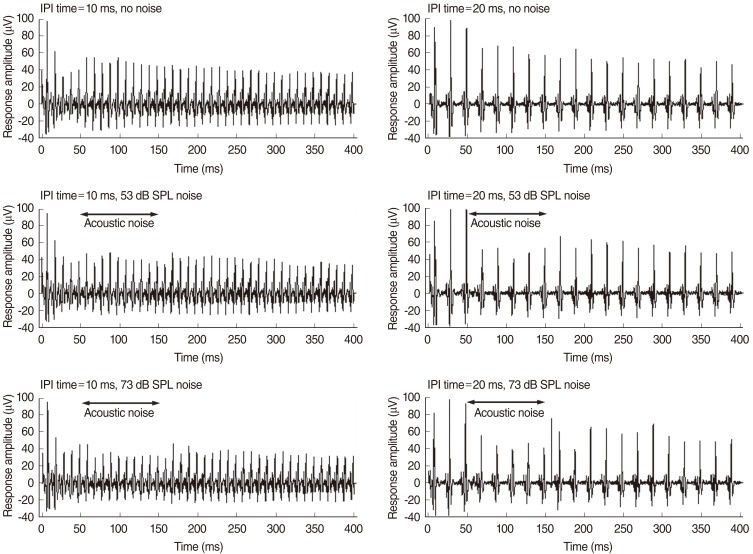
In Fig. 4, acoustic noise of 53 or 73 dB SPL was presented to the right ear in the 50-150 ms interval after the onset of the electric stimulus. The response amplitude to the electric pulse train stimuli decreased slightly when acoustic noise was presented contralateral to the electric stimulus. This is an example of the effect of masking acoustic noise on the response to electric pulse train stimuli. The response amplitude decreased more after the contralateral presentation of an acoustic noise of 20 ms IPI than after 10 ms IPI.
Fig. 5 shows the effects of ipsilateral and contralateral acoustic noise on the IC response. There were clearly fewer spikes during the presentation of acoustic noise ipsilateral to the electric stimulus. Furthermore, immediately after the onset of acoustic noise, the response pattern changed transiently with shorter response intervals. When the acoustic noise was presented contralateral to the electric stimulus, fewer spikes were only observed immediately after the onset of the acoustic noise.
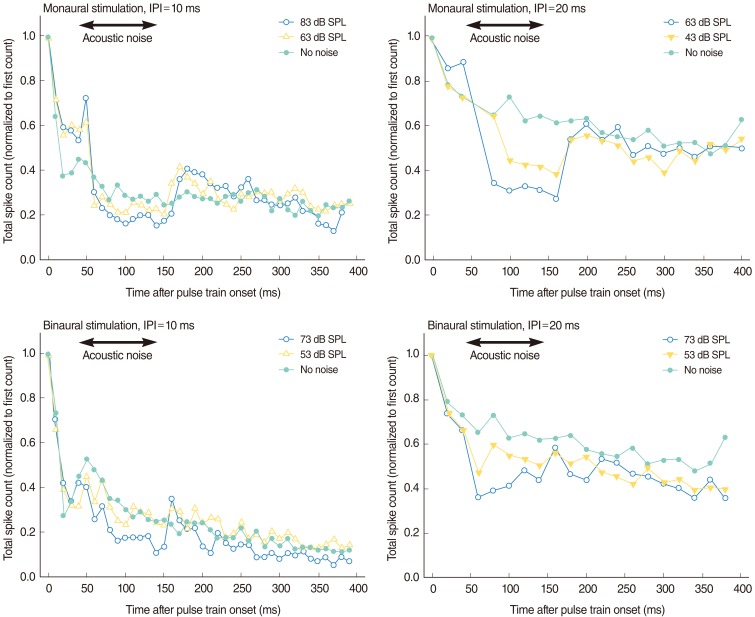
Fig. 6 shows the effects of acoustic noise of different levels on the IC response to combined electric and acoustic stimuli. Compared with binaural presentation (an electric stimulus presented to the left ear and an acoustic stimulus to the right), monaural presentation (electric and acoustic stimuli presented to the left ear) reduced the normalized spike counts more markedly when the acoustic noise was presented. For both monaural and binaural presentations, the IC response to the combined electric and acoustic presentations decreased during the presentation of acoustic noise and the degree of the decrement was proportional to the acoustic noise level. The decrement in the IC response during acoustic noise presentation was larger during monaural presentation than during binaural presentation. The pattern of decrement also differed; although the binaural effect was relatively small and noisy, our data demonstrate that it was an onset-type effect, whereas the monaural effect was a more steady-state effect. This difference may reflect the difference between the peripheral and central masking of the acoustic noise with an acoustic stimulus. That is, the effect of peripheral masking on the IC response was larger than the effect of central masking. The latter was also an onset-type effect, whereas the former was a more steady-state effect. This result indicates that acoustic-electric interactions can occur with both within-ear (monaural) stimulation and across-ear (binaural) stimulation, although the nature of these interactions is not the same for the two stimulation modes. We note that the binaural interactions occurred at moderate and low levels of acoustic stimulation. Inter-aural attenuation of an acoustic click (as assessed by click-evoked ABR) has been known to be at least 50 dB for stimulation of guinea pigs with a closed acoustic system [14]. This suggests that the noise effects reported here (Fig. 5) are not attributable to acoustic cross talk.
Fig. 7 summarizes the data for the effects of interaural time delay between the binaural stimuli, according to the type of stimuli. These results indicate that the maximal reduction in the total spike number occurred when the electric stimulus was delayed by 2.0 ms relative to the acoustic stimulus. This delay time approximately coincided with the relative latency difference (2.0-2.5 ms with similar stimulation levels) in the two responses measured from the IC [19]. For the acoustic stimulus, the delay time producing the maximal reduction in the total spike number was 0.5 ms.
DISCUSSION
To investigate central masking by analyzing electric-acoustic interactions, we used an acute animal model in which hearing was preserved as much as possible. Although this model is quite different from clinical cases of human auditory disorders, it seems to be appropriate for investigating electric-acoustic binaural interactions and central masking effects. Such an animal model is also expected to be free of the central, plastic changes that result from chronic deafness and degeneration of the peripheral system.
Because the ventromedial mid- to high-frequency parts of the IC receive only contralateral input [19], our recording of the right IC response to left electric stimuli combined with acoustic stimuli from right was useful for two reasons. First, the electric stimuli were applied to the basal turn of the left cochlea and the responses were usually recorded from the ventromedial mid- to high-frequency parts of the right IC. Therefore, the changes in the IC responses were not contaminated by the responses to the right acoustic stimulus itself. Second, the spikes from the electric stimuli were easily separable from those from the acoustic stimuli according to the spike threshold and latency criteria.
Most previous studies have involved far-field potential recordings using surface electrodes in animals [20] or humans [21, 22]. The effects of central masking were evaluated by measuring the delay in the latency or the reduction in the amplitudes according to the stimulus levels. The latency of wave V increased significantly at noise levels of 80 and 90 dB hearing level [22] or the amplitude of wave V decreased [21]. This reduction in amplitude, which was specific to wave V, has been suggested that the effect is central and that the particular locus for this aspect of central masking is at the level of the IC. However, the IC cannot be solely responsible for the change in amplitude or latency of wave V. The waves I-V in ABR are not generated serially from separate auditory nuclei in the brainstem. It has clearly been demonstrated that P2 and P4-P5 are generated by brainstem nuclei in distinct, parallel pathways. For instance, the destruction of ventral cochlear nucleus would severely interrupt wave V generation [23]. In another human study of ABR, contralateral masking had no effect on either the latency or the amplitude of wave V for noise levels up to 75 dB SPL [24]. Dobie and Wilson [25] reported a small but significant increase in wave V latency when they compared the sum of monaural brainstem auditory evoked responses (BAERs) collected with no noise with the sum of monaural BAERs collected with masking noise presented to the contralateral ear at 73 dB SPL. They reported no gross effects of various contralateral noise levels (up to 88 dB SPL) on wave V in three normal-hearing subjects. Although contralateral masking had no effect on the binaural interaction wave obtained from ABR, there was a small but significant increase in wave V latency in the monaural sum waveforms when contralateral noise was used. These inconsistent results may arise from the limitations inherent in measuring the central masking effect from the gross evoked potential, because relatively small changes in neural activity or excitatory/inhibitory changes are not reflected in gross field potentials. Measurements of ABR made in the IC generally show greater response amplitudes than measurements made with surface electrodes [26]. An invasive procedure was ultimately required to ascertain the neuronal basis of these phenomena, reported in previous investigations.
Binaural interactions are most likely to appear when the two stimuli are very similar in time and intensity. Because central masking is one of the binaural interactions that occur in the central auditory system, it should be apparent when the two stimuli are very similar. Furst et al. [27] reported that binaural interactions in the human ABR are dependent on the interaural time and the intensity of the clicks presented dichotically. They reported that no binaural interaction was seen for large interaural delays (>1 ms) or large interaural-level differences (>30-40 dB). They also found no binaural interaction when the stimuli presented to the two ears were dissimilar. Although both noise and click are spectrally broad, one is continuous and the other is impulsive, and they would therefore not fuse into a single perceptual image. Consequently, according to Furst et al. [27] these stimuli would not produce a binaural interaction. As reported in our results, the contralateral noise effect to pulse was trivial compared with the pulse-to-click or click-to-click binaural stimuli.
The response amplitude of the electric pulse train stimuli decreased markedly when the acoustic noise was presented ipsilateral to the electric stimulus. When acoustic noise was presented contralateral to the electric stimulus, the response amplitude to the electric pulse train stimuli decreased slightly. In ipsilateral masking, both peripheral and central auditory pathways contribute to the masking effect. By contrast, in the case of contralateral masking, only neural interactions in the central auditory pathway contribute to the masking effect. Consequently, stronger masking effects should be expected for ipsilateral masking. This binaural interaction takes place from the brainstem level and ipsilateral acoustic masking could also activate the medial olivocochlear (MOC) efferent system, which could be regarded as both peripheral and central mechanisms recruited at the same time [28, 29]. The MOC effects from studies in guinea pigs showed that the ipsilateral reflex is twice as strong as the contralateral reflex [30]. The ipsilateral and contralateral MOC effect ratio has been proved to be dependent on noise bandwidth. For narrow-band centered elicitors, ipsilateral MOC effects were much greater than contralateral, but for wide-band elicitors, the ipsilateral and contralateral effects were similar in human [31].
From the masking study between acoustic and electric stimulation in human recently showed that the acoustic masking data were more consistent with the central theory of auditory masking. In case of ipsilateral masking of acoustic and electric stimulation in this study, both peripheral and central auditory pathways should contribute to the masking effect. However, functional hair cells are most likely lacking in the basal part of the cochlea in cochlear implant subjects and observed acoustic masking was not due to the efferent and transmitter mechanisms but rather a result of the central interactions [32].
Data from middle-latency auditory evoked potential tests have indicated that noise may also have an effect above the IC [33]. When a 40 Hz auditory steady-state response (ASSR) was used to monitor the events at a probable site of their interaction (the auditory cortex), increasing levels of contralateral noise progressively reduced the ASSR amplitude [34, 35]. Consequently, recordings from the IC cannot fully explain the psychoacoustic results. However, our results are quite consistent with the following previously reported psychoacoustic results. The effect of pulsed noise was greater than that of continuous noise [21]. A higher threshold shift was observed with contralateral masking during pulsed masking stimuli than during the continuous masking stimuli or continuous presentation in the Bekesy procedure [36]. Central masking was maximum when the masking sound was presented in bursts and the threshold was determined at the onset of the bursts. The threshold shift decreased rapidly with the time delay and also as the frequency difference between the test and masking sound increased [3].
Central masking in normal-hearing subjects shows a correction factor of 5-10 dB [37] or no correction factor if either a wide- or narrow-band masker is used [38]. Because surface-recorded auditory potential data are only indirectly related to psychoacoustic phenomena [39], there are some unexplained inconsistencies between the psychoacoustic tests and the evoked potential tests without malingering. Understanding the neurophysiology of central masking may lead to a better view of this discordance in the future.
The effect of ipsilateral and contralateral masking observed in the central nucleus of the IC might be the overall effect of central auditory system including brain stem and midbrain. Overall mechanism of the central making cannot be explained by our findings only, unless the activity of MOC cells together with the IC recordings in case of masking is studied. However, even though we could not explain the whole mechanism of masking, our results showed the effect of masking could be observed in the central nucleus of the IC.
In conclusion, our results suggest that central masking is quite different from peripheral masking and occurs within the binaural auditory system, and this study showed that the effect of masking could be observed in the IC recording. These effects are more evident and consistent with the psychophysical data from spike number analyses than with the previously reported gross potential data via the interaction between excitatory and inhibitory neural process of contralateral input to the other side as suggested in the earlier study [40].