

INTRODUCTION
Hearing plays a crucial role in children for developing verbal language. This is demonstrated by language delays observed among children with hearing impairment. Sensorineural hearing impairment alters speech perception in a complex nonlinear manner. Speech perception and speech production are intrinsically linked to one another in terms of communication, hence if speech perception is affected, it will also have an impact on speech production.
The speech of deaf children has been studied for many years (1-3). Reports on the speech of deaf children examined 1) differences in the speech of deaf children as a function of hearing loss and/ or perceptual abilities (4); 2) differences in the speech of deaf children as a function of hearing device viz. via hearing aid or cochlear implants (5); 3) longitudinal changes in the speech of deaf children (3, 6); or 4) deviation of speech acoustics of deaf children relative to those of normal hearing children (7-9). These studies have used different methods for analyzing speech of the hearing impaired both perceptually and objectively and have offered a variety of results.
Cochlear implants have enabled a number of severely hearing impaired individuals to access auditory information and improve speech perception as well as speech production skills. Several studies demonstrate that multi-channel cochlear implants also promote the development of speech perception and speech production in prelingually deafened children (3, 5).
One of the objective methods of assessing speech production is spectrography, which is a prime technique for making acoustic measurements of speech production. The speech spectrograph provides detailed quantitative information regarding speech waveform, including intensity, frequency, duration and spectral analysis (10). Acoustic correlates of speech from cochlear implantees are different from normal hearing children and understanding of the differences will provide us with additional objective information that will be a precursor to therapy planning.
A study conducted by Uchanski and Geers (11) compared children with hearing impairment using hearing aids with those using cochlear implants. The results revealed that a large percentage (46% to 97%) of the young cochlear implantees produced acoustic characteristics values within the normal range. Liker et al. (12) found that implanted children had a smaller and fronted vowel space, their /s/ and /Ōł½/ noise frequencies overlapped, and affricates were longer, with a high proportion of incorrect productions and substitutions.
According to the Indian National Sample Survey Organization's 2002 survey (NSSO) in the 58th round, the estimated number of individuals (above 5 years of age) with a profound hearing impairment was 96 per 100,000 persons in rural areas and 92 per 100,000 persons in urban areas. The count of individuals with severe hearing impairment was 123 per 100,000 persons in rural areas and about 113 per 100,000 persons in urban areas. The number of individuals with moderate hearing impairment was 90 per 100,000 persons among rural communities and 84 per 100,000 persons in urban communities. From these figures offering insight to the large number of children having hearing loss, it is evident how needs of services related to habilitation/speech language intervention as hearing is an extremely important sensory mode to develop and use verbal language. Many parents in India are now opting for cochlear implants for their hearing impaired children. Use of cochlear implants has been a turning point in the life of hearing impaired children enabling them to participate in the world of sounds. In India there are more than 10,000 cochlear implantees.
It is important to analyze speech acoustics of cochlear implantees to determine the underlying reasons for their individual differences in speech production and their ability (or lack thereof) to produce the different sounds within their language. Numerous studies have focused on English language analysis as well as other languages (Tamil, Kannada, Malayalam, etc.) but there is paucity of studies regarding the Hindi language. All the aforementioned aforementioned languages are Dravidian languages whereas Hindi is an Indo-Aryan language, emphasizing differences in structure. Therefore the results of studies related to Dravidian languages cannot be generalized to Hindi. In addition, there is a paucity of studies focusing on acoustic characteristics of speech in Hindi speaking hearing impaired children using cochlear implants, hence the need for the present study. This will further help in planning intervention treatments for improving speech intelligibility.
The aim of this study was to analyze and compare the acoustic speech characteristics of the cochlear implantees and normal hearing age matched peers.
MATERIALS AND METHODS
A total of 30 subjects with ages ranging between 5 to 11 years participated in the study. The subjects were divided into two groups. Group I was comprised of 15 children with prelingual bilateral severe to profound hearing loss. Selected subjects were within age range between 5 to 11 years (average age, 7.5 years) and had received implants between the ages of 4 to 10 years (average age, 5.2 years). Prior to implantation, subjects used analog behind the ear hearing aids while prior and post implantation they had received at least one year of intervention (aural/oral). Group II was comprised of 15 school going children (5 to 11 years, average age 6.9 years) with normal hearing sensitivity. These selected subjects were age matched with the subjects from group I. Recordings of sustained productions of /e/, /i/, and /u/ as well as words with selected consonants in medial positions were done. Recorded samples were analyzed in terms of their acoustic characteristics using Praat software (doing phonetics by computer; http://www.fon.hum.uva.nl/praat/). The means and standard deviations of the values of the aforementioned parameters for both the groups were computed. To determine statistically significant difference between the two groups, data was analyzed using the Student's t-test. All hypotheses were tested at 0.005 level of significance.
RESULTS
For both the groups means and standard deviation of aforementioned parameters were computed. Two tailed t-test was performed in order to observe whether any significant difference existed between cochlear implantees and age matched normal hearing peers with respect to the said parameters. Results revealed the following.
Vowels
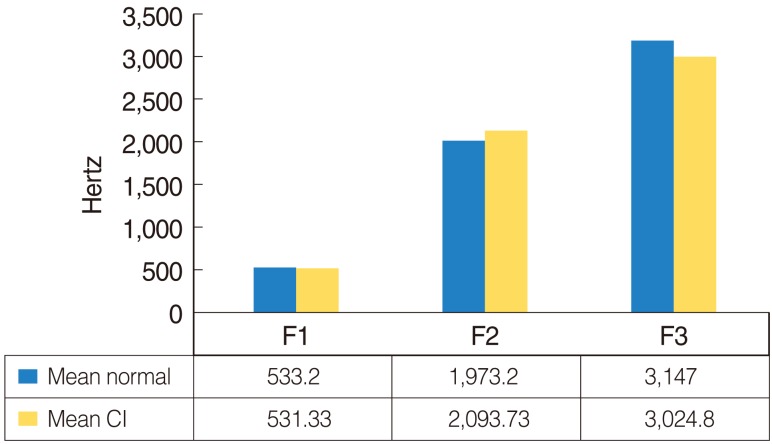
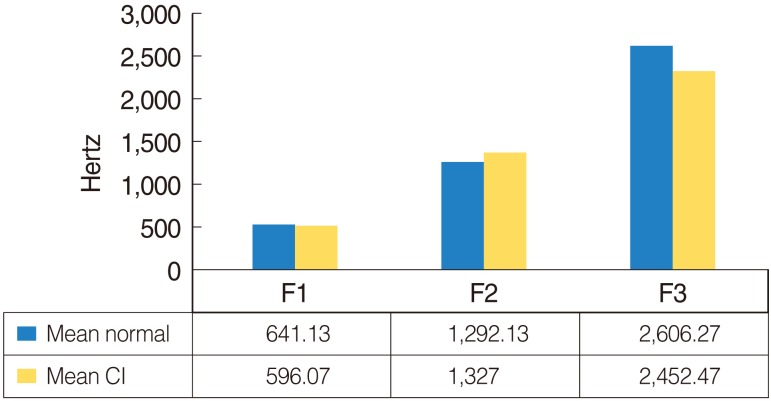
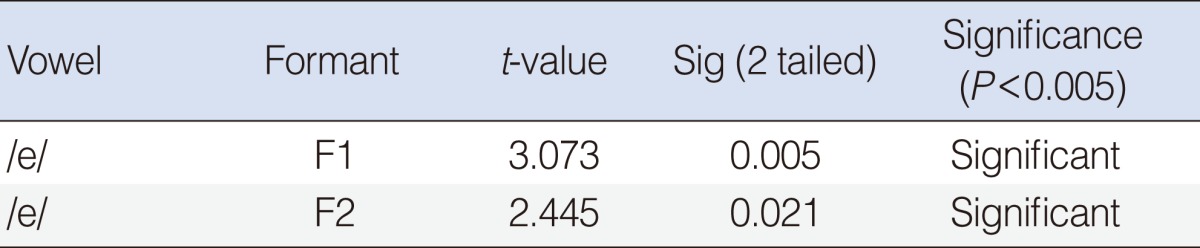
Means of F1 and F2 formant values of /e/ from the cochlear implantees CI (976.47 Hz, 1621.93 Hz, respectively) were lower than those of normal hearing peers (1,125.27 Hz, 1,734.4 Hz, respectively, t-value for F1=3.073, P<0.005 and t-value for F2=2.445, P<0.021 indicating significant difference). This is depicted in Table 1 and Fig. 1.
Centre frequency of burst for /p/ and /b/
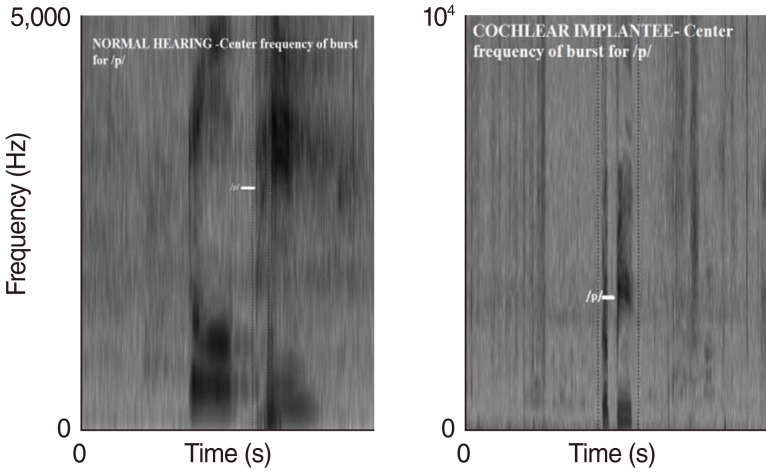
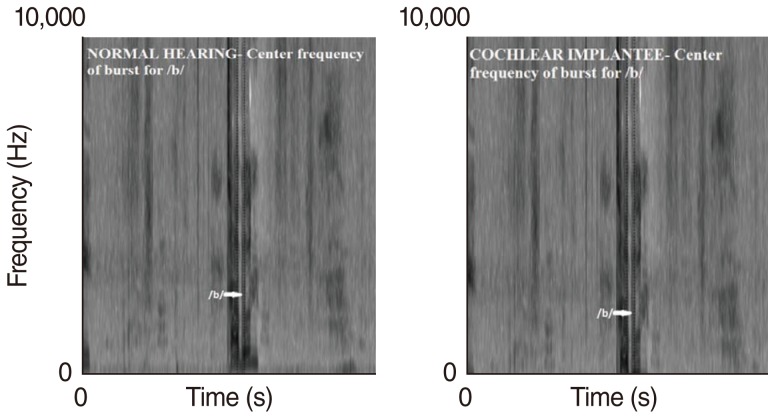
A statistically significant difference was obtained between the two groups for the means of center frequency of burst for /p/ (t-value=-1.179, P<0.005). The means of center frequency of burst for /p/ of cochlear implantees was 1,156 Hz which is higher than that of normal hearing peers (932 Hz) (Fig. 5). However, no significant difference between cochlear implantees and normal hearing age matched peers for the means of center frequency of burst for /b/ (1,215 Hz, 1,073 Hz, respectively) was observed (Fig. 6).
Voice onset time (VOT) values for /p/ and /b/:
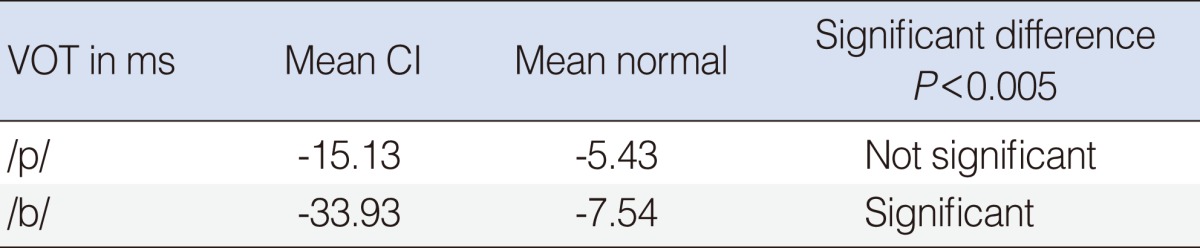
A t-value for the means of VOT in ms for /p/ was -1.0499 (P<0.005) indicating no significant difference between the two groups. However, a significant difference was found for VOT in ms for /b/ (t-value=-2.001, P<0.005). Means of VOT in ms for both the groups are shown in Table 3.
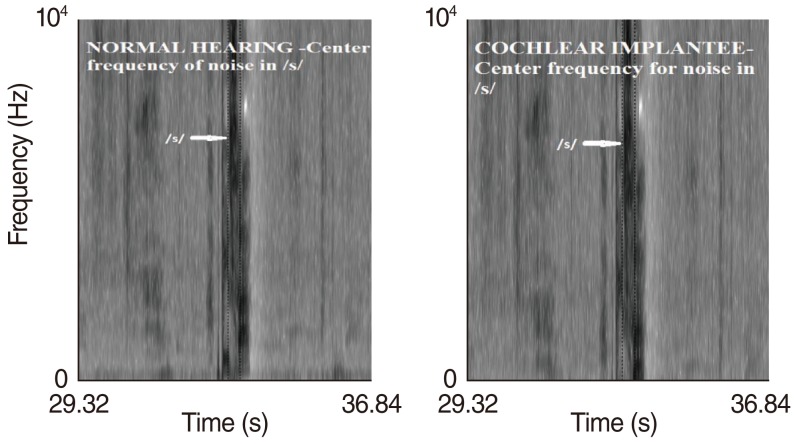
Centre frequency of noise in /s/
No significant differences between CI and normal hearing subjects for centre frequency of noise in /s/ (t-value=0.025, P<0.005) (Fig. 7) were observed.
Affricates
A significant difference was found in the rise time for affricate /tŌł½/, that is, 'ch' as in 'church' (CI, 42.5 ms; normal hearing, 24.53 ms). No significant difference was found in the rise time for affricate /╩ż/, that is 'j' as in 'judge' (CI, 23.87 ms; normal hearing, 23 ms). Production of voiced affricate is much easier than its voiceless cognate. Voiced affricate /╩ż/ is louder than its counterpart and as a result easier to perceive.
DISCUSSION
Vowels
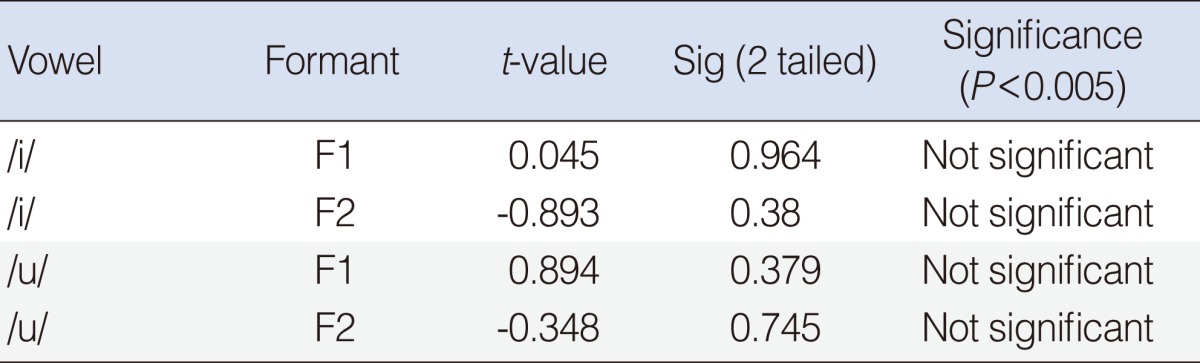
In the present study, a significant difference was found in the production of the vowel /e/ which is an intermediate vowel, where as no difference was found in the production of point vowels /i/ and /u/. According to Svirsky and Tobey (13) with the help of orosensory cues (tactile and proprioceptive) which are more for /i/ and /u/ than in /e/, and with the use of quantal properties of the speech processor system (14), the point vowels /i/ and /u/ can have normalized F1 and F2 values. However, for the production of intermediate vowels like /e/, auditory information plays an important role. The results of this study are in agreement with the study of Svirsky and Tobey (13), further emphasizing the role of auditory stimulation in production for vowels, particularly more so for intermediate vowels than point vowels. This information could be considered for selecting vowels while making an intervention plan.
Center frequency of burst for /p/ and /b/
Some of the earliest spectral (normative) data on stop burst were reported by Halle et al. (15). Their results indicated that the bilabial /p/ was associated with primary concentration of energy in the low frequencies, from about 500-1,500 Hz. In the present study, the mean value of central frequency of burst of /p/ for cochlear implantees was measured to be 1,156.14 Hz, which is within the range of normative data. In the present study the mean for center frequency of burst of /p/ for cochlear implantees was 1,156 KHz and normal hearing 932 KHz; both are within normal range. However, with an extended duration of implant use over several years, children who use cochlear implants may be expected to have lower values.
Voice onset time (VOT) values for /p/ and /b/
According to various studies, VOT appeared to be considered important for distinguishing voiceless and voiced consonants. The results of the present study show that the values of VOT produced by cochlear implantees were within the normal range and are supported by those of Tobey et al. (3) and Fourakis (6) who found increased VOT contrasts by two years of cochlear implant use. In the present study, four children who used implants for two years or more had VOT values within the normal range. This implies that VOT contrasts can be developed (after at least 2 years of implant use) and can be included in the intervention plan.
Center frequency of noise in /s/
The effect of auditory feedback provided by cochlear implants is intended not only to improve vowel acoustics but also for the production of sibilant like /s/. The results of the present study revealed that there are no differences between CI and normal hearing subjects for production of /s/. These results are supported by a study performed by Matthies et al. (16) in which the analysis of the spectra of sibilant sounds were obtained prior to implant activation and after use, auditory feedback provided by the cochlear implants allow the subjects to monitor and maintain the production of /s/. Use of multichannel cochlear implants mimics the tonotopic organization of cochlea and enhances all sounds, even the high frequency sibilants like /s/, whereas those using hearing aids may not receive this benefit.
Affricates
Affricate /tŌł½/ is voiceless while /╩ż/ is voiced. Production of voiced affricates is much easier than its voiced cognate. Voiced affricate /╩ż/ is louder than its counterpart, thus easier to perceive. Intervention with respect to improving production of affricates can be initiated by selecting the voiced affricate prior to its voiceless cognate.
From this series of analyses, we were able to conclude that auditory feedback through the cochlear implant appears to help children with hearing impairment improve their speech production skills which is reflected in their acoustic characteristics. Some parameters are enhanced more than others. Therefore, acoustic analysis of speech from cochlear implantees appears to be an essential method of analysis in order to study the particular acoustic characteristics which have or have not been improved by cochlear implantation and subsequently plan necessary intervention.