

INTRODUCTION
A flow-volume (F-V) curve is the most clinically useful of several pulmonary function tests. It is a graphic plot consisting of inspiratory and expiratory flow (on the y-axis) against volume (on the x-axis) obtained while a patient performs maximal forced inspiratory and expiratory maneuvers [1,2]. The F-V curve provides useful information about lung function and the relationship between lung volume and the maximum rate of airflow [2,3].
Although the usefulness of the F-V curve has been investigated for many types of respiratory diseases, it has been considered the single best pulmonary function test for identifying upper airway stenosis since Miller and Hyatt [4] reported in 1969 that a plateau shaped F-V curve occurs with progressively smaller airways. Since then, the shape of the F-V curve has been used to clinically diagnose and localize upper airway stenosis [5,6].
In addition, it has been reported that a unilateral main bronchial stenosis can be identified using the shape of the F-V curve. In 1990, Gascoigne et al. [7] first described the biphasic change in the expiratory phase of the F-V curve in two patients with unilateral main bronchial stenosis. After the first case report, several case reports and studies over the next 20 years identified a biphasic F-V curve pattern in patients with a unilateral main bronchial stenosis [8,9,10,11,12].
However, changes in the F-V curve according to the degree of unilateral main bronchial stenosis have not been evaluated. The purpose of this study was to identify changes in the F-V curve according to the degree of stenosis in patients with unilateral main bronchial stenosis.
MATERIALS AND METHODS
Study population
We retrospectively reviewed all consecutive patients who underwent both bronchoscopy and chest computed tomography (CT) between January 2005 and December 2011 at Samsung Medical Center (a 1,961-bed, university-affiliated, tertiary referral hospital in Seoul, Korea).
After reviewing the medical records of all patients who underwent both tests, patients >18 years of age who were diagnosed with unilateral bronchial stenosis by both bronchoscopy and chest CT were eligible for this study.
The patients diagnosed with unilateral main bronchial stenosis by only one method were excluded because of doubt about the accuracy of the diagnosis. If we had included patients who did not undergo bronchoscopy, there was a risk of including inappropriate cases such as those with combined other-airway stenosis. In addition, in cases where the existence of a solitary main bronchial stenosis was unclear on flexible bronchoscope owing to advanced stenosis-a flexible bronchoscope (outer diameter 5.2 mm) could not be passed through the stenotic lesion-it was impossible to identify any stenosis in the distal large airway. We included the only patient who had the absence of any additional stenosis below the main bronchus confirmed by interventional bronchoscopy. However, if we included patients who had not undergone chest CT, there was a risk of inclusion of inappropriate cases such as patients with diseases associated with a decrease of lung volume.
Patients were also excluded if they had a history of airway disease, such as chronic obstructive pulmonary disease (COPD) or asthma, had a combination of other-airway stenosis including tracheal or in a lobar, segmental or subsegmental bronchus in addition to that in the main bronchus, had a totally collapsed lung because of stenosis of the main bronchus or had diseases associated with decreased lung volume observed on a chest CT scan, such as interstitial lung disease, malignancies involving the lung parenchyma, bronchiectasis or destructive parenchymal sequelae of pulmonary tuberculosis.
The Institutional Review Board of Samsung Medical Center approved the study and the review and publishing of information from the patient records. Informed consent was waived because of the retrospective nature of the study.
Analysis of the F-V curve
We analyzed F-V curves performed during the week before bronchoscopy and chest CT. A biphasic F-V curve was defined as having two distinct plateau phases. A monophasic F-V curve was defined as having only one plateau phase [7,8,9,10,11,12,13]. In addition, the breakpoint of the F-V curve was defined as the meeting point of the different plateau phases. All expiratory phases of the F-V curves in patients with unilateral main bronchial stenosis were classified by their gross appearance as monophasic or biphasic according to these definitions. In addition, we digitized the graphs and extracted the data points using Engauge Digitizer 5.1 software (M. Mitchell, Engauge Digitizer, http://digitizer.sourceforge.net) [14,15]. This software package digitizes and extracts data values from a graph and was used here to identify the breakpoints and obtain all original (x, y) data from the graphs. In the supplemental data, we include examples of monophasic curves, biphasic curves and their breakpoint (Supplementary Fig. 1), and examples of the process of digitizing and extracting data values from a graph (Supplementary Fig. 2).
Degree of main bronchial stenosis
The degree of main bronchial stenosis was classified into five grades using a proposed central airway stenosis classification system [16]. Grade I was defined as ≤25% stenosis, grades II-IV were defined as 26%-50%, 51%-75%, and 76%-90% decrease in cross-sectional area, respectively. Grade V was defined as >90% to near-complete obstruction without collapse of the ipsilateral lung. We determined the degree of airway stenosis at the time of inspiration during bronchoscopy and a chest CT scan. The degree of airway stenosis during bronchoscopy was determined by interventional pulmonologists (YK and HK) and during the chest CT scan by radiologists (CAY and KSL). The degree of airway stenosis was determined during expiration to evaluate dynamic stenosis.
Statistical analysis
Data are presented as medians and interquartile range (IQR) for continuous variables and as numbers (percentage) for categorical variables. Data were compared using the Mann-Whitney U-test for continuous variables. All statistical analyses were performed by economist (JGY) using Stata ver. 12.0 (StataCorp LP, College Station, TX, USA), using two-sided P-values.
RESULTS
During this 7-year study, 168 patients (1.4%) were diagnosed with a unilateral main bronchial stenosis by both bronchoscopy and CT scan. Of these, 137 were excluded: those with a history of small airway disease including COPD and asthma (n=3), patients with stenosis of other airways including trachea or lobar, segmental, or subsegmental bronchi (n=89), and those with diseases associated with decreased lung volume such as interstitial lung disease, bronchiectasis, or destructive parenchymal sequelae of tuberculosis (n=45). Therefore, 29 patients with unilateral bronchial stenosis were included and analyzed in this study.
Patient characteristics
The demographic and descriptive data of the 29 patients are summarized in Table 1. The patients were predominantly female (69%) and young (median age, 34 years; IQR, 26.0 to 44.5 years). All 29 patients had a stenotic lesion in the left main bronchus. The degree of bronchial stenosis included grade I (n=4, 13.8%), grade II (n=3, 10.3%), grade III (n=3, 10.3%), grade IV (n=8, 27.5%), and grade V (n=11, 37.9%). Posttuberculosis bronchial stenosis (86.2%) was the most common primary cause of bronchial stenosis in this study. Other causes included hamartoma, submucosal seromucinous gland hyperplasia, bronchial carcinoid tumor, and leiomyoma.
Changes in F-V curve according to the degree of stenosis
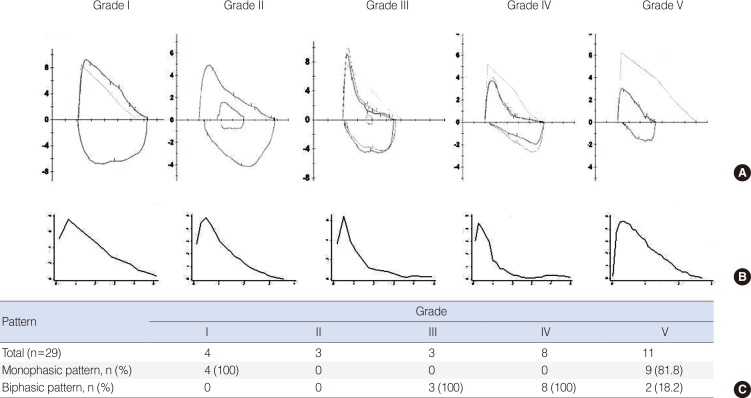
Representative F-V curves classified according to the degree of unilateral bronchial stenosis are shown in Fig. 1A. Only monophasic F-V curves were observed during expiration in cases of low-grade stenosis, such as the grade I stenosis shown in Fig. 1C. However, a biphasic F-V curve was consistently observed in cases of advanced stenosis of grades II-IV. Both monophasic and biphasic F-V curves were observed in high-grade (grade V) stenosis; however, the majority of the F-V curves for grade V stenosis were monophasic (81.8%).
The median graphs of the F-V curve during expiration based on the degree of stenosis are presented in Fig. 1B. The median F-V curve graphs were also monophasic in cases of a low degree of stenosis or the most advanced stenosis-such as grade I or V. However, the median graphs of the F-V curve for grades II-IV were biphasic, similar to the individual F-V curves.
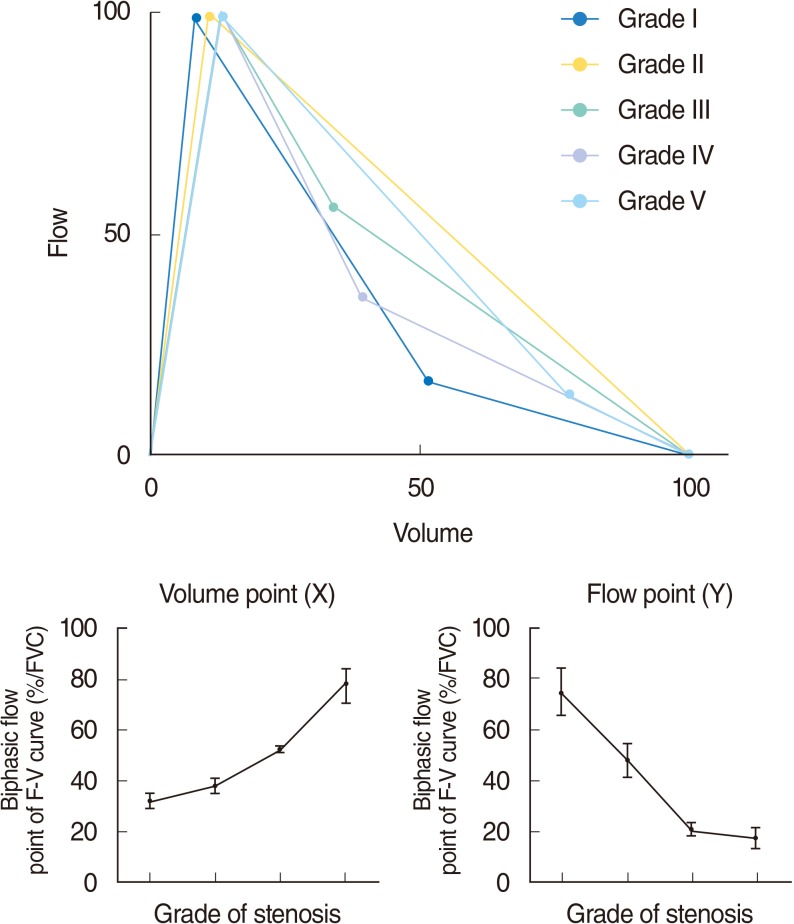
We also analyzed the shape of the F-V curve by locating the breakpoint and evaluated this according to the degree of main bronchial stenosis (Fig. 2). After standardization of each graph to the maximal flow and volume values, we constructed a standardized graph using the median value of the breakpoint according to the degree of stenosis. The more advanced the unilateral bronchial stenosis, the more the breakpoint moved in the direction of high volume (x-axis) and low flow (y-axis). Consequently, the F-V curve was a good approximation of the ventilation of one lung. Next, F-V curves were grouped according to the degree of stenosis, i.e., grades II and III or grades IV and V. The breakpoints for grades IV and V moved significantly toward high volume (x-axis) and low flow (y-axis) compared with those for grades II and III (P<0.001).
DISCUSSION
This is the first study to focus primarily on the clinical and physiological relevance of changes in the shape of the F-V curve in patients according to the degree of unilateral main bronchial stenosis. Unilateral bronchial stenosis is a very rare disorder; few case reports have correlated the shape of the F-V curve with unilateral main bronchial stenosis [7,8,9,12,17]. The American Thoracic Society/European Respiratory Society statement (2005) of interpretative strategies for the lung function test did not recommend a typical pattern for the F-V curve in cases of a unilateral main bronchial stenosis, whereas the plateau pattern of the F-V curve is useful for diagnosis in cases of tracheal stenosis [2]. Furthermore, no study has assessed the clinical usefulness of the F-V curve in patients with unilateral main bronchial stenosis.
We hypothesized that there would be a characteristic change in the F-V curve based on the degree of main bronchial stenosis, as reported for tracheal stenosis [4]. Miller and Hyatt [5] demonstrated the clinical usefulness of the F-V curve in stenosis by obtaining F-V curves from seven healthy volunteers breathing through calibrated fixed orifices that decreased in diameter from 10 to 4 mm. However, we could not prove our hypothesis experimentally because of limitations in the anatomical and physiological characteristics of unilateral main bronchial stenosis. Thus, we demonstrated our hypothesis by analyzing F-V curves in actual patients according to the degree of their unilateral main bronchial stenosis.
The physiological mechanism resulting in a biphasic F-V curve in patients with a unilateral main bronchial stenosis can be explained by the two-compartment lung model [10,11,18,19]. This physiological and anatomical model suggests that a biphasic F-V curve is a two-compartment phenomenon characterized by sequential or asynchronous emptying of the lung units [19,20]. In other words, the expiratory flow of a normal main bronchus is followed by the delayed expiratory flow of the stenotic main bronchus. Thus, the expiratory phase of a biphasic F-V curve is composed of two distinct F-V curves; the early phase is determined by the normal lung and the late phase by the abnormal lung.
However, such a biphasic pattern was not identifiable during either the inspiration phase of the F-V curve in previous case reports or in those of the 29 patients assessed in this study [7,8,9,12,17]. This can be explained by positive transmural pressure upon inspiration; that is, the bronchial pressure exceeds the surrounding pleural pressure, so no downstream compression occurs, resulting in greater inspiratory flow such as with intrathoracic stenosis of the trachea [1].
The F-V curve in patients with severe obstructive pulmonary diseases, such as COPD or asthma, appears biphasic because of small airway narrowing, which increases the time required to empty the lung [2,3]. However, the F-V curve is not identical to that in cases of unilateral main bronchial stenosis because there is no breakpoint. For this reason, we excluded from our analysis patients with a history of obstructive pulmonary disease including COPD or asthma.
The present study had several limitations. First, the majority of our patients had posttuberculosis main bronchial stenosis, which may have affected the rate of decline in lung volume and flow, which in turn would change the geometry of the F-V curve. For this reason, we excluded patients who had a decreased lung volume because of pulmonary tuberculosis detected on a chest CT scan. In addition, the patients with posttuberculosis main bronchial stenosis were distributed within the advanced stenosis groups. Although this might affect the result, we attempted to include all eligible patients among the 12,056 who underwent both bronchoscopy and chest CT during the study period.
Second, all bronchial stenoses in patients included in this study were located in the left main bronchus. However, most main bronchial stenoses caused by benign or malignant growths are found in the left main bronchus because it is 5 cm longer than the right main bronchus [21,22]. In addition, we excluded other-airway stenosis, such as stenosis of the lobar bronchus or right bronchus intermedius, to ensure an accurate diagnosis and analysis. As the average length of the right main bronchus is about 2.5 cm, all patients with right main bronchial stenosis were excluded because of combined other-airway stenosis. It is generally accepted that the functioning of the right lung is greater than that of the left [23]. Thus, the F-V curve of a patient with right main bronchial stenosis may differ from that of a patient with a left bronchial stenosis because of a change in F-V curve geometry. However, a right main bronchial stenosis is rare because of the shortness of this segment, and almost all main bronchial stenoses are located in the left main bronchus. Thus, the F-V curve of a left main bronchial stenosis can be considered representative of unilateral main bronchial stenoses.
Changes in the F-V curve according to the degree of stenosis in the unilateral main bronchial stenosis were identified in an actual case in the supplement (Supplementary Fig. 3).
In conclusion, we found clinical and physiological changes in the expiratory phase F-V curve in patients with unilateral main bronchial stenosis. In unilateral bronchial stenosis, a biphasic F-V curve appeared when bronchial stenosis was >25% and disappeared with near-complete obstruction. Furthermore, the shape of the biphasic F-V curve changed with the progression of stenosis because of the migration of the breakpoint.