

INTRODUCTION
Tympanic membrane perforation is relatively a common finding, and it is caused by various factors including trauma and otitis media. Perforated eardrum results in conductive hearing loss, and this range is reported not to exceed 50 dB [1,2,3]. But the effects of tympanic membrane perforations on middle-ear sound transmission are not well characterized, largely because ears with perforations typically have additional pathological changes [1,2,3].
Delivery of sound to the middle ear is known to be based on the sound pressure difference between the external and middle ear, and corresponding models have been suggested [1,2,3]. According to corresponding models, the size of perforation and the volume of middle ear and mastoid are related to the degree of hearing loss, and the significance has been reported in other study [4]. However, the impedance audiometry has been used to estimate the volume of middle ear and mastoid pneumatization, which may be limitation of those studies.
In this study, the authors measured the size of perforation, the volume of middle ear and mastoid pneumatization on temporal bone computerized tomography (TBCT), and the location of the perforation in the patients with tympanic membrane perforation and intact ossicular chain. The purpose of this study was to investigate how these factors affect the hearing.
MATERIALS AND METHODS
Subjects
Among the adult patients who underwent tympanoplasty type I or myringoplasty at Seoul National University Hospital between 2010 to 2012, the patients only with the following criteria were included; (1) no soft tissue density in the middle ear or mastoid on TBCT that was taken before surgery, (2) tympanic membrane perforation, (3) no history of otorrhea or no otorrhea during the past 12 months, (4) better than 10 dB of the postoperative mean air-bone gap (ABG) at 6 months after surgery, (5) no inflamed tissue in the middle ear and no manipulation of the ossicles based on the operation records. The patients for revision operations were excluded in this study. Finally, a total of 42 patients could be included for this study. The mean age of the subjects was 45.7┬▒2.4 years old, and there were 20 males and 22 females included.
Measurement of tympanic membrane perforation size
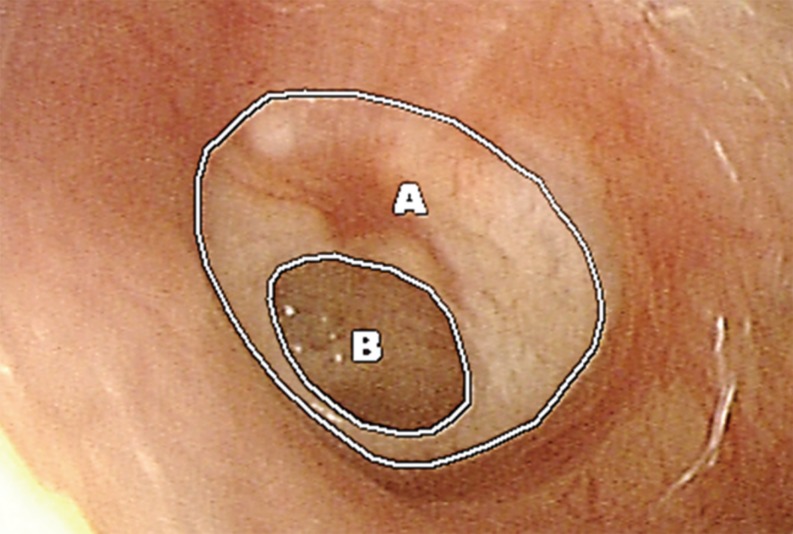
The photograph of tympanic membrane was taken one day before operation, and the ratio of perforation size to the entire tympanic membrane area was measured (Fig. 1) by M-view 5.4 software (Marotech, Seoul, Korea). The patients were divided into four groups according to their sizes of perforation (group I: 0%-10%, n=12; group II: 11%-20%, n=13; group III: 21%-30%, n=9; group IV: >30%, n=10) since there were not many patients with perforation more than 30%.
Measurement of middle ear and mastoid pneumatization volume
TBCT were taken with a 0.6-mm slice thickness and by setting the orbitomeatal plane as the standard, and made the axial plane parallel to this standard. Imaging condition was 120 kV, 200 mAs, and the image files were saved as digital imaging and communication in medicine files, and then were sent to personal computers.
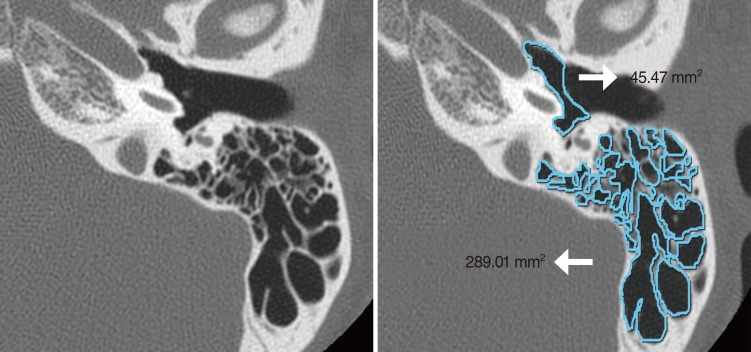
The areas of middle ear and mastoid were measured on the axial images of TBCT using picture archiving communication system (PACS), M-view 5.4 software. The upper limit was set as the cross section that begins to show superior semicircular canal, and the lower limit was set as the tip of mastoid process (Fig. 2). The total volume of middle ear and mastoid was obtained by multiplication of the total area by the distance between the cross sections (0.6 mm). And the total area was the sum of the each areas that were measured PACS, M-view 5.4 software.
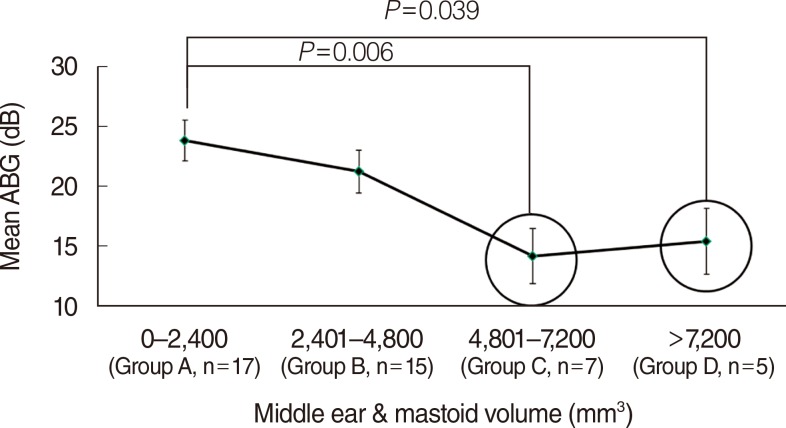
Patients were divided into four groups according to their middle ear and mastoid pneumatization volume (group A: 1-2,400 mm3, n=17; group B: 2,401-4,800 mm3, n=15; group C: 4,801-7,200 mm3, n=7; group D: >7,200 mm3, n=5).
Location of tympanic membrane perforation
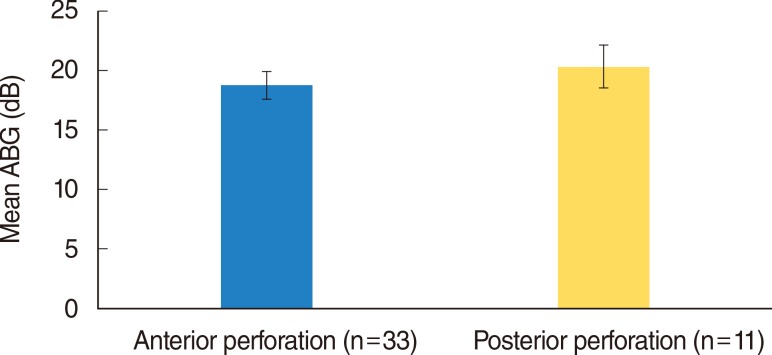
The location of tympanic membrane perforation was categorized into anterior (n=33) and posterior (n=11) perforations based on the relation of the center of the perforation with the line extending from the malleus handle.
Statistical analysis
Spearman rank-order correlation was used to analyze the correlation among the size of tympanic membrane perforation, the volume of middle ear and mastoid, and the location of tympanic membrane perforation. Univariate general linear model (three-way analysis of variance [ANOVA]) was used to analyze the effects of size of tympanic membrane perforation, the volume of middle ear and mastoid, and the location of perforation on the mean ABG. Significance was set at P<0.05, and PASW ver. 18.0 (SPSS Inc., Chicago, IL, USA) was used for statistical analysis.
RESULTS
The mean ABG was 19.9 dB. There was no significant relation between the size of tympanic membrane perforation and the volume of middle ear and mastoid (P=0.862, Pearson correlation), or between the location of tympanic membrane perforation and the volume of middle ear and mastoid (P=0.412, Pearson correlation). There was no significant difference in the size of perforation according to the location of tympanic membrane perforation (P=0.161, Pearson correlation). The univariate general linear model, three-way ANOVA, and scheffe post hoc test, showed that the size of tympanic membrane perforation and the volume of middle ear and mastoid pneumatization significantly affected the mean ABG. There was no effect of the perforation location on the mean ABG (Table 1). The volume of middle ear and mastoid pneumatization (F=6.004) seemed to be more effective than the size of tympanic membrane perforation (F=4.269).
Size of tympanic membrane perforation
Fig. 3 shows the the mean ABG according to the size of perforation. The post hoc analysis showed significant difference in the mean ABG between the groups I (0%-10%) and III (21%-30%, P=0.008), and between the groups I and IV (>30%, P=0.048). There was a tendency that the mean ABG increased as the size of tympanic membrane perforation increased.
Volume of middle ear and mastoid pneumatization
Fig. 4 shows the mean ABG according to the volume in each group. The post hoc analysis showed significant difference in the mean ABG between groups A and C (P=0.006), and between groups A and D (P=0.039). There was the tendency that the mean ABG decreased as the volume of middle ear and mastoid pneumatization increased.
Location of tympanic membrane perforation
Fig. 5 shows the mean ABG according to the location of perforation. The mean ABG was bigger in the posterior perforation group, but the difference between the two groups was 0.12 dB, which is not significant.
DISCUSSION
In normal ears, the difference in sound pressure that develops in the border of tympanum causes the movements of eardrum and ossicles [3]. Voss et al. [1,2,3] reported that hearing loss in case of tympanic membrane perforation is caused by decreased negative pressure between the external and middle ear when the eardrum was the boundary, and that this difference in negative pressure is determined by the impedance of tympanic membrane perforation and of middle ear, when the movements of ossicles were hypothesized as normal. Therefore, a simple model was suggested based on the auditory structure to predict hearing loss due to tympanic membrane perforation. Mehta et al. [4] used this model for their study and demonstrated that hearing loss in case of tympanic membrane perforation is greater with larger size of perforation and with smaller middle ear and mastoid volume. However, it was not be related to the location of tympanic membrane perforation.
Our results also showed that the mean ABG significantly increased as the size of perforation increased (P=0.018) and the volume of middle ear and mastoid decreased (P=0.005), which is well agreed with the other previous studies [4,6,7,8,9]. There was no difference in the mean ABG according to the location of perforation (P=0.924). There are two major differences between the previous reports by others and this study. Firstly, in the previous studies above, the impedance audiometry was used to estimate the volume of middle ear and mastoid pneumatization [4]. However, the volume exceeding 7 mL could not be measured due to limitation of the instrument, thus in that cases the data were processed as 7 mL, which would be one of the limitations of that study [4]. In addition, although there have been reports on the feasibility of the impedance audiometry for the measurement of the middle ear and mastoid volume [10,11], but when this method was used in case of small volume of middle ear and mastoid, the error increased [4]. In contrast, in this study, the volumes of middle ear and mastoid pneumatization were obtained by multiplication of the total area of pneumatization in the middle ear and mastoid by the distance between the cross sections on TBCT. One limitation of this study is that mastoid pneumatization above the superior semicircular canals could not be included since TBCT did not cover these area in some of the patients. Secondly, previous studies used Student t-test to prove significance [4], whereas in this study, univariate general linear model, three-way ANOVA was used.
Mastoid pneumatization begins from 33rd week after birth, and develops until the age of 15 for boys, and 10 for girls [12,13,14]. However, the degree of pneumatization between individuals is known to show a big difference [15,16], and that the volumes of normal ears are in the range of 2-20 mL. The volume of mastoid pneumatization in Korean adults was 7,095.2 mm3 in average, but showed to have big standard deviation of 3,087.1 mm3, which demonstrated individual diversity [17]. The difference on mastoid pneumatization may come from pathological changes in the middle ear and mastoid due to the otitis media that developed after birth [16,18,19,20].
In conclusion, hearing loss in case of tympanic membrane perforation was related to the size of perforation and the degree of middle ear and mastoid pneumatization when the mucosa inside the middle ear cavity and ossicles were hypothesized as normal. This shows that not only the size of perforation but also the degree of middle ear and mastoid pneumatization need to be considered when we treat the patients with tympanic membrane perforation. Therefore, small pneumatization of middle ear and mastoid may be the causative reason as long as middle ear and ossicles are normal when ABG is relatively larger than that expected from the size of perforation. In these cases, successful closures of ABG after tympanoplasty can be expected without manipulation of ossicles. Further studies may be needed on middle ear and mastoid pneumatization through reconstruction of 3-dimensional images of TBCT.