Tobacco Smoking and Alcohol Consumption Are Related to Benign Parotid Tumor: A Nested Case-Control Study Using a National Health Screening Cohort
Article information

Abstract
Objectives.
To evaluate the relationship among smoking, alcohol consumption, and obesity and benign or malignant parotid tumors in a Korean population.
Methods.
The Korean National Health Insurance Service-Health Screening Cohort (for ≥40-year-olds) was assessed from 2002 to 2013. In total, 336 benign parotid tumors and 46 malignant parotid tumors were matched with controls at a ratio of 1 to 4 with respect to age, sex, income, region of residence, hypertension, diabetes, and dyslipidemia. We analyzed previous histories of smoking, alcohol consumption, and obesity. By unconditional logistic regression analyses, the crude and adjusted odds ratios (ORs) were investigated and the 95% confidence intervals (CIs) were counted.
Results.
The estimated annual incidence of the benign parotid tumors was 5.66 per 100,000, and that of the malignant parotid tumor was 0.81 per 100,000. The adjusted ORs of smoking for the benign parotid tumors was 2.52 (95% CI, 1.84 to 3.46). This finding was consistent in the subgroups of <60 years old, ≥60 years old, and men. The adjusted ORs of alcohol consumption for the benign parotid tumors showed the statistical significance only in women (adjusted OR, 2.35; 95% CI, 1.10 to 5.00). Obesity did not reach a statistical significance in any analysis.
Conclusion.
Benign parotid tumor was related with smoking, and it was linked with alcohol consumption in women only.
INTRODUCTION
The parotid gland is the most prevalent salivary tumor site, accounting for about 80% to 85% of salivary gland tumors [1]; about 80% of these tumors are benign, and the remainder are malignant [1]. Pleomorphic adenoma is the most prevalent benign parotid tumor, and Warthin tumor is the second [2]. The incidence of benign parotid tumors is 4.7 to 6.2 per 100,000 a year, and that of malignant parotid tumors is 0.4 to 0.87 per 100,000 a year in the USA and UK [3,4]. Malignant parotid tumors are highly rare, accounting for <10% of all of head and neck cancers [1]. No study has reported the incidence of parotid tumors in Korea before.
To date, the etiology of parotid tumor is not well understood because of its rare incidence. Radiation exposure, smoking, alcohol consumption, dietary factors, cellphone use, and virus exposure are suggested as the possible risk factors [5-7]. However, the results are inconsistent. As far as we know, no study has reported the etiology of parotid tumors in Korea.
The aim of this study was to evaluate the relation between benign or malignant tumors and the possible risk factors, including tobacco smoking, alcohol consumption, and obesity, using a national health check-up cohort of the Korean population. Additionally, we reported the estimated parotid tumor incidence using our data. In this study, we analyzed the odds of smoking, drinking alcohol, and obesity in parotid tumors compared to the 1 to 4 matched control group.
MATERIALS AND METHODS
Ethical considerations
The ethics committee of Hallym University College of Medicine (No. 2017-I102) approved the use of these data. The study was excused from the written informed consent by the Institutional Review Board.
Study population and data collection
The data from the Korean National Health Insurance Service-Health Screening Cohort was used [8]. The Korean National Health Insurance Service (NHIS) chooses about 10% of random samples (n=about 515,000) directly from all people who had a health check-up from 2002 through 2003 year (n=about 5,150,000). The age and sex specific distributions of the cohort population is described in online [9,10].
All of ≥40 years old Koreans and their families are requested to have a biannual health check without cost [11]. Because all Korean citizens are registered with a 13-digit resident registration number for lifelong, the thorough population statistics can be calculated in this study. All Koreans have to register in the NHIS. The 13-digit resident registration number has to be used in all Korean hospitals and clinics. Thus, the medical records was prevented to be overlapped, even in case of a patient moves from one place to another. In addition, the Korean Health Insurance Review and Assessment (HIRA) system managed all medical treatments in Korea. The causes and date of death diagnosed by medical doctors on the death certificate are legally announced to administrative entity.
This NHIS included health insurance claim codes (procedures and prescriptions), diagnostic codes using the International Classification of Disease-10 (ICD-10), death records, socioeconomic data and health check-up data (body mass index [BMI], drinking, smoking habit, blood pressure, urinalysis, hemoglobin, fasting glucose, lipid parameters, creatinine, and liver enzymes) for each participant over the period from 2002 to 2013 [10,11].
Participant selection
Out of 514,866 cases with 497,931,549 medical claim codes, the participants who were defined as having benign parotid tumors (n=360) or malignant parotid tumors (n=50) were included. The participants (control group) who were never diagnosed with benign or malignant parotid tumors were 1 to 4 matched with each parotid tumor patients. The control groups were randomly selected from the identical cohort population (n=531,162). The subjects were matched by age group, sex, income group, region of residence, and medical histories (e.g., hypertension, diabetes, and dyslipidemia). It was presumed that the matched control participants and each matched benign or malignant parotid tumor participant were examined at the identical time (index date). Thus, the deceased participants before the index date were excluded. The benign or malignant parotid tumor participants who had no previous history of a health check-up before the index data were excluded (n=24 and n=4, respectively). No participant was excluded because of insufficient matching participants. Finally, the one to four matching resulted in the inclusion of 336 benign parotid tumor participants and 1,344 control I participants, and 46 malignant parotid tumor participants and 184 control II participants. We analyzed the previous health check-up data in the parotid tumor and control groups after matching (Fig. 1). In this study, we used the latest health checkup data before the index date.
Schematic illustration of the participant selection process used in the present study. Of a total of 514,866 participants, 336 benign parotid tumor patients were matched with 1,344 control I participants (A), and 46 malignant parotid tumor patient were also matched with 184 control II participants (B) based on age, sex, income, region of residence, and past medical history.
Variables
Independent variable
Tabaco smoking was categorized as the current smoking state (nonsmoker, past smoker, and current smoker), duration of smoking (nonsmoker, <20 years, and ≥20 years), and current cigarette smoking per a day (0 cigarette a day, <20 cigarettes a day, and ≥20 cigarettes a day) (Table 1). Because every smoking categories showed a difference between the benign parotid tumor and control I group (Table 1), we selected the current smoking state for this study. Below, we used “smoking” as current smoker compared to nonsmoker or past smoker.
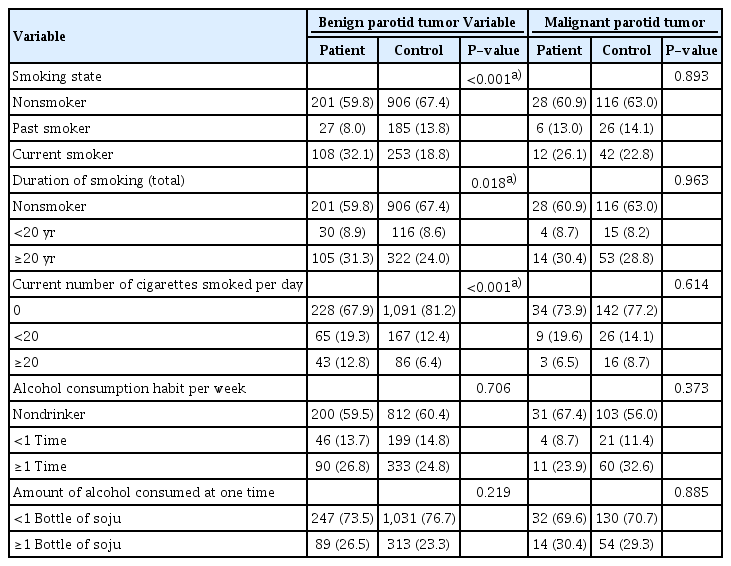
Smoking and alcohol consumption
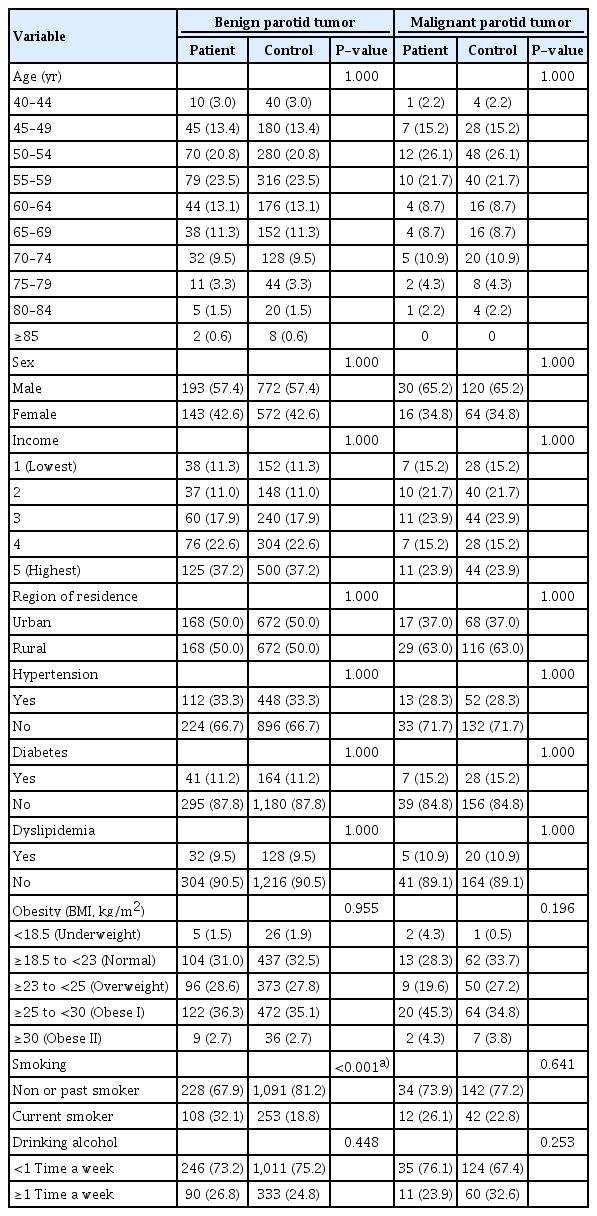
Alcohol consumption was categorized as the frequency (<1 time a week, and ≥1 time a week) and the amount of alcohol consumed at a time (<1 bottle and ≥1 bottle of soju) (Table 1). We selected the frequency of drinking alcohol in this study. Below, we used “alcohol consumption” as drinking alcohol ≥1 time a week compared to drinking <1 time a week. Obesity was measured using the BMI (kg/m2). It was categorized as <18.5 (underweight), ≥18.5 to <23 (normal), ≥23 to <25 (overweight), ≥25 to <30 (obese I), and ≥30 (obese II) according to the Regional Office for the Western Pacific 2000 [12].
Covariate
The 5-year age intervals were used to classify the age groups. The income groups were divided into five classes (class 1 [lowest income]–5 [highest income]). The region of residence was grouped into urban and rural areas. The ICD-10 codes were evaluated to identify the participants’ prior medical histories. The hypertension (I10 and I15), diabetes (E10–E14), and dyslipidemia (E78) were defined who visited clinics or hospitals ≥2 times with each diagnosed codes.
Dependent variable
A parotid tumor was defined using the ICD-10 code as follows: D11 for benign parotid tumor and C07 for malignant parotid tumor. Among these tumors, we only included the participants who were treated with parotidectomy (claim codes: Q2231 or Q2232).
Statistical analysis
The general characteristics between the benign or malignant parotid tumors and their control groups were compared using chi-square tests. To analyze the odds ratio (OR) of smoking, alcohol consumption, and obesity for the benign or malignant parotid tumors, an unconditional logistic regression analysis was performed. A crude (simple) and adjusted models (adjusted model for age, sex, income, region of residence, hypertension, diabetes, dyslipidemia, obesity, smoking state, and frequency of alcohol consumption) were used. The 95% confidence interval (CI) was calculated.
We subgrouped the participants according to age and sex (<60 years, ≥60 years, male, and female) for the benign parotid tumors. Dividing the age group was determined around the median value of the total number of participants. Two-tailed analyses were conducted, and P-values less than 0.05 were considered to indicate significance. The results were statistically analyzed using IBM SPSS ver. 22.0 (IBM Corp., Armonk, NY, USA).
RESULTS
In this study, we estimated the incidence of benign parotid tumor as 5.66 per 100,000 a year (360/514,866 for 12 years), and that of malignant parotid tumor as 0.81 per 100,000 a year (50/514,866 for 12 years). The rate of smoking was higher in the benign parotid tumors (32.1%, 108/336) than in the control group (18.8%, 253/1,344) (Table 2). Alcohol consumption and obesity were not different in the benign parotid tumors and control I group. Neither smoking, alcohol consumption nor obesity showed a difference between the malignant parotid tumors and the control II group. The general characteristics (age, sex, income, region of residence, hypertension, diabetes, and dyslipidemia histories) of the participants were the same due to the matching procedure (P=1.000).
General characteristics of participants
The adjusted ORs of smoking for the benign parotid tumors was 2.52 (95% CI, 1.84 to 3.46; P<0.001) (Table 3). The adjusted ORs of alcohol consumption and obesity did not reach statistical significance. For the malignant parotid tumors, none of these reached a statistical significance.

Crude and adjusted odd ratios (95% CI) of smoking, drinking alcohol, and obesity for benign or malignant parotid tumor
For the benign parotid tumors and control I group, we performed the subgroup analyses according to age and sex. For these, the adjusted ORs of smoking reached statistical significance in <60 years old, ≥55 years old, and men (Table 4). Specifically, the adjusted ORs of alcohol consumption showed a statistical significance in women only (adjusted OR, 2.35; 95% CI, 1.10 to 5.00; P=0.027).

Crude and adjusted odd ratios (95% CI) of smoking, drinking alcohol, and obesity for benign parotid tumor in each stratified group according age and sex
DISCUSSION
In the present study, for the first time, we reported the annual incidence of benign parotid tumors as 5.66 per 100,000 and malignant parotid tumors as 0.81 per 100,000 in ≥40-year-olds in Korea. Previously, the incidence of annual benign parotid tumors was reported as 4.7 to 6.2 per 100,000, and that of malignant parotid tumors was 0.4 to 0.87 per 100,000 in USA and UK [3,4]. These findings were in keeping with our results. A higher odds for smoking was observed in the benign parotid tuen in the USA [21]. Because we did not have pathology data, we could not analyze the ORs according to each pathological type of parotid tumor. We assumed that the inclusion of Warthin tumors might increase the OR of smoking for benign tumors in this study.
We could not find any study that reported the association between alcohol consumption/obesity and benign parotid tumors. On the other hand, some studies report the association between alcohol consumption and salivary gland tumors. However, the results are inconsistent. Alcohol consumption is related to malignant salivary gland tumors only in men (OR, 2.5; 95% CI, 1.1 to 5.7) in a study [22], and that was linked in women only (OR, 5.5; 95% CI, 1.8 to 16.9) in another study [14]. Other studies report no associations [23-26]. Several studies report no association between obesity and malignant salivary gland tumors [24, 26-28]. In this study, we found that benign parotid tumors were related with alcohol consumption only in women. Chronic exposure of alcohol cause morphologic and functional changes in the salivary gland [29], which can increase various types of cancer [30]. In esophageal and liver cancer, the alcohol related risk was higher in women than in men [30]. We think that the salivary gland is affected by alcohol consumption differently according to sex, and this might have originated from the difference in smoking and alcohol consumption according to sex (Supplementary Table 1).
This study has several advantages. To the best of our knowledge, this study is the first to evaluate the incidence and etiological factors of parotid tumors in Korea, which were not reported due to rarity. We used a large representative nationwide population based on a health check-up. We analyzed the odd ratios of smoking, alcohol consumption, and obesity in benign or malignant parotid tumors compared to the appropriately matched control group. The participants in the control group were randomly selected and matched for age, sex, income, region of residence, and medical histories to avoid confounding effects. We used the previous health check-up records before the diagnosis of parotid tumor to avoid cognitive bias. In addition to using the matched control group for the general characteristics and past medical histories, we used an adjusted logistic regression model.
This study has several limitations. As stated above, we do not have the information about the pathology of the parotid tumors. Therefore, we could not analyze the ORs according to pathologic types. Even though we followed up about a half million participants for 12 years, only a small number of the participants were included in this study due to the rare incidence of parotid tumors. Specifically, only 50 of malignant parotid tumors were included. Therefore, all of the analyses did not reach statistical significance. We used patient claim codes in the HIRA data to identify the parotid tumors. This could over or under estimate the incidences. The participants were surveyed for their health status and habits, which could be distorted by their memory. We could not calculate the total amount of smoking and alcohol consumption due to the categorical questionnaire. We do not have the data from the participants who under 40 years of age because the health check-up was taken after 40 years.
The odds of smoking were increased in the benign parotid tumor patients, except for women. The odds of alcohol consumption were increased in the benign parotid tumor patients in only women compared to the control group.
HIGHLIGHTS
▪ The etiology of parotid tumor is not well understood.
▪ For the first time, we reported the annual incidence of benign parotid tumors as 5.66 per 100,000 and malignant parotid tumors as 0.81 per 100,000 in ≥40-year-olds in Korea.
▪ A higher odds for smoking was observed in the benign parotid tumor participants (adjusted odds ratio [OR], 2.52; 95% confidence interval [CI], 1.84 to 3.46).
▪ The odds for alcohol consumption was higher only in women with benign parotid tumors (adjusted OR, 2.35; 95% CI, 1.10 to 5.00) compared to the controls.
Notes
No potential conflict of interest relevant to this article was reported.
Acknowledgements
This work was supported in part by a research grant (NRF-2018-R1D1A1A02085328) from the National Research Foundation (NRF) of Korea, Seoul, Korea.
Notes
AUTHOR CONTRIBUTION
Conceptualization: HGC. Data curation: CM. Formal analysis: HGC. Funding acquisition: HGC. Methodology: HGC. Project administration: HGC. Visualization: DJO. Writing - original draft: SYK. Writing - review & editing: HGC, SYK, CM, DJO.
SUPPLEMENTARY MATERIALS
Supplementary materials can be available at https://doi.org/10.21053/ceo.2018.01774.
The rates of smoking, alcohol consumption, and obesity according to age group and sex in benign parotid tumor and control