


INTRODUCTION
Peripheral sensory loss causes many changes in the central nervous system. This phenomenon is known as central neural plasticity. The changes due to sensory loss begin immediately after the loss of peripheral neural input and continue indefinitely (until death). These changes have been measured using various methods, including evoked potentials, electrophysiological studies, behavioral tests, molecular studies, and imaging modalities such as positron emission tomography (PET), functional magnetic resonance imaging, functional near-infrared spectroscopy, and magnetoencephalography [1-7].
Changes in the brain due to congenital or prelingual deafness are considered to be developmental deficits due to the loss of peripheral auditory signals. In this situation, the brain is not exposed to auditory signals during a developmental period. In contrast, acquired or postlingual deafness occurs after the central auditory system has completed its development; thus, the signaling pathway was intact before hearing loss (HL). Postlingual HL also affects the central auditory system. However, in terms of development, individuals with prelingual deafness have more obstacles to overcome than those with postlingual deafness.
Neuroimaging studies have revealed several changes in the central nervous system in patients with postlingual deafness. Decreased glucose metabolism has been detected in both the anterior cingulate gyri and superior temporal cortices and in the right parahippocampal gyrus [8]. White matter also changes after late-onset deafness, with decreased fractional anisotropy and increased radial diffusivity [9]. Animal studies have shown the same pattern of decreased metabolism in the auditory cortical area [10].
These changes in the central auditory system have very important implications for hearing rehabilitation. Once changed, the neural system will not return to its previous state even after hearing rehabilitation, and its recovery is affected by the duration of deafness, and the time interval within which recovery is possible is known as the critical period [11,12]. Cochlear implants are used for hearing restoration in patients with profound postlingual deafness. Many researchers have attempted to determine the relationship between the duration of HL and the critical period of rehabilitation for cochlear implant users. Studies have shown that the duration of deafness is the most important prognostic factor for hearing rehabilitation with cochlear implants [13-15]. The duration of deafness is negatively correlated with the postoperative auditory performance of cochlear implant users, and early hearing rehabilitation results in better auditory performance. Numerous studies have attempted to predict postoperative hearing results using preoperative diagnostic measurements. However, the results of cochlear implantation (CI) are variable, even if it is not performed too late after HL [16].
Several studies have reported that resting-state PET images can predict the results of CI [2,15,17]. Resting-state brain glucose utilization is related to basal cellular function and is considered an index of integrated local synaptic activity [18]. Some recent studies have reported that long-term HL disrupted the connectivity of brain networks and altered resting-state networks and activities [19,20].
We hypothesize that CI would change the resting-state cortical networks compared with the deaf state. Most previous animal studies were performed using congenital deaf cat models. To date, no studies have been conducted with an acquired HL cat model. Thus, we attempted to measure the time interval between electrical cochlear stimulation and changes in restingstate network activity using an acquired deafness cat model. To investigate resting-state neuronal networks after CI, we acquired 18F-fluorodeoxyglucose (FDG)-PET imaging from the experimental animals.
MATERIALS AND METHODS
Animals and hearing measurement
Eight domestic cats were included in the study. Seven were male, and one was female. All cats were adults (body weight, 2.7–5.5 kg; age, 12–24 months) and had normal hearing thresholds (under 20 dB SPL at click stimulation). All cats showed normal external auditory canals and tympanic membranes on otoscopic examination. The animals were divided into two groups: HL control (n=4) and CI group (n=4). Hearing thresholds were measured using auditory brainstem response (ABR) to click sounds. Subdermal needle electrodes were located below the ear and vertex. The Intelligent Hearing System (HIS Inc.) was used to measure the ABR threshold. The stimulus rate was 19.1/sec using the click sound in rarefaction mode. The response was amplified, bandpass filtered (100–1,500 Hz), and averaged to create overstimulation (512 sweeps per stimulation). Hearing thresholds were measured at normal hearing status and during the deafening procedure. Deafness was confirmed 2 weeks after the deafening procedure. All experiments were approved by the Institutional Animal Care and Use Committee (IACUC No. 35-2015-00-84).
Deafening procedure
All animals were deafened by co-administration of kanamycin and ethacrynic acid, following a previously reported method [21,22]. All procedures were performed under anesthesia using Zoletil (Virbac Laboratories). The cats were anesthetized with an intramuscular injection of 0.2-mL Zoletil. Before the deafening procedure, hearing thresholds were measured to confirm the normal threshold range. For deafening, kanamycin (kanamycin sulfate, Yuhan) was dissolved in normal saline and injected subcutaneously into the posterior neck area (500 mg/kg). After 30 minutes, ethacrynic acid (ethacrynate sodium, MSD) dissolved in normal saline was continuously infused intravenously at a rate of 1 mg/min using an infusion pump. The ABR threshold was measured continuously during the infusion of ethacrynic acid using 60-, 70-, 80-, and 90-dB SPL click sounds repeatedly. When the ABR wave V disappeared at the 90 dB SPL click sound, the infusion was stopped. Two weeks later, ABR was measured using a 90 dB SPL click sound to confirm the deafened status.
Cochlear implantation and stimulation
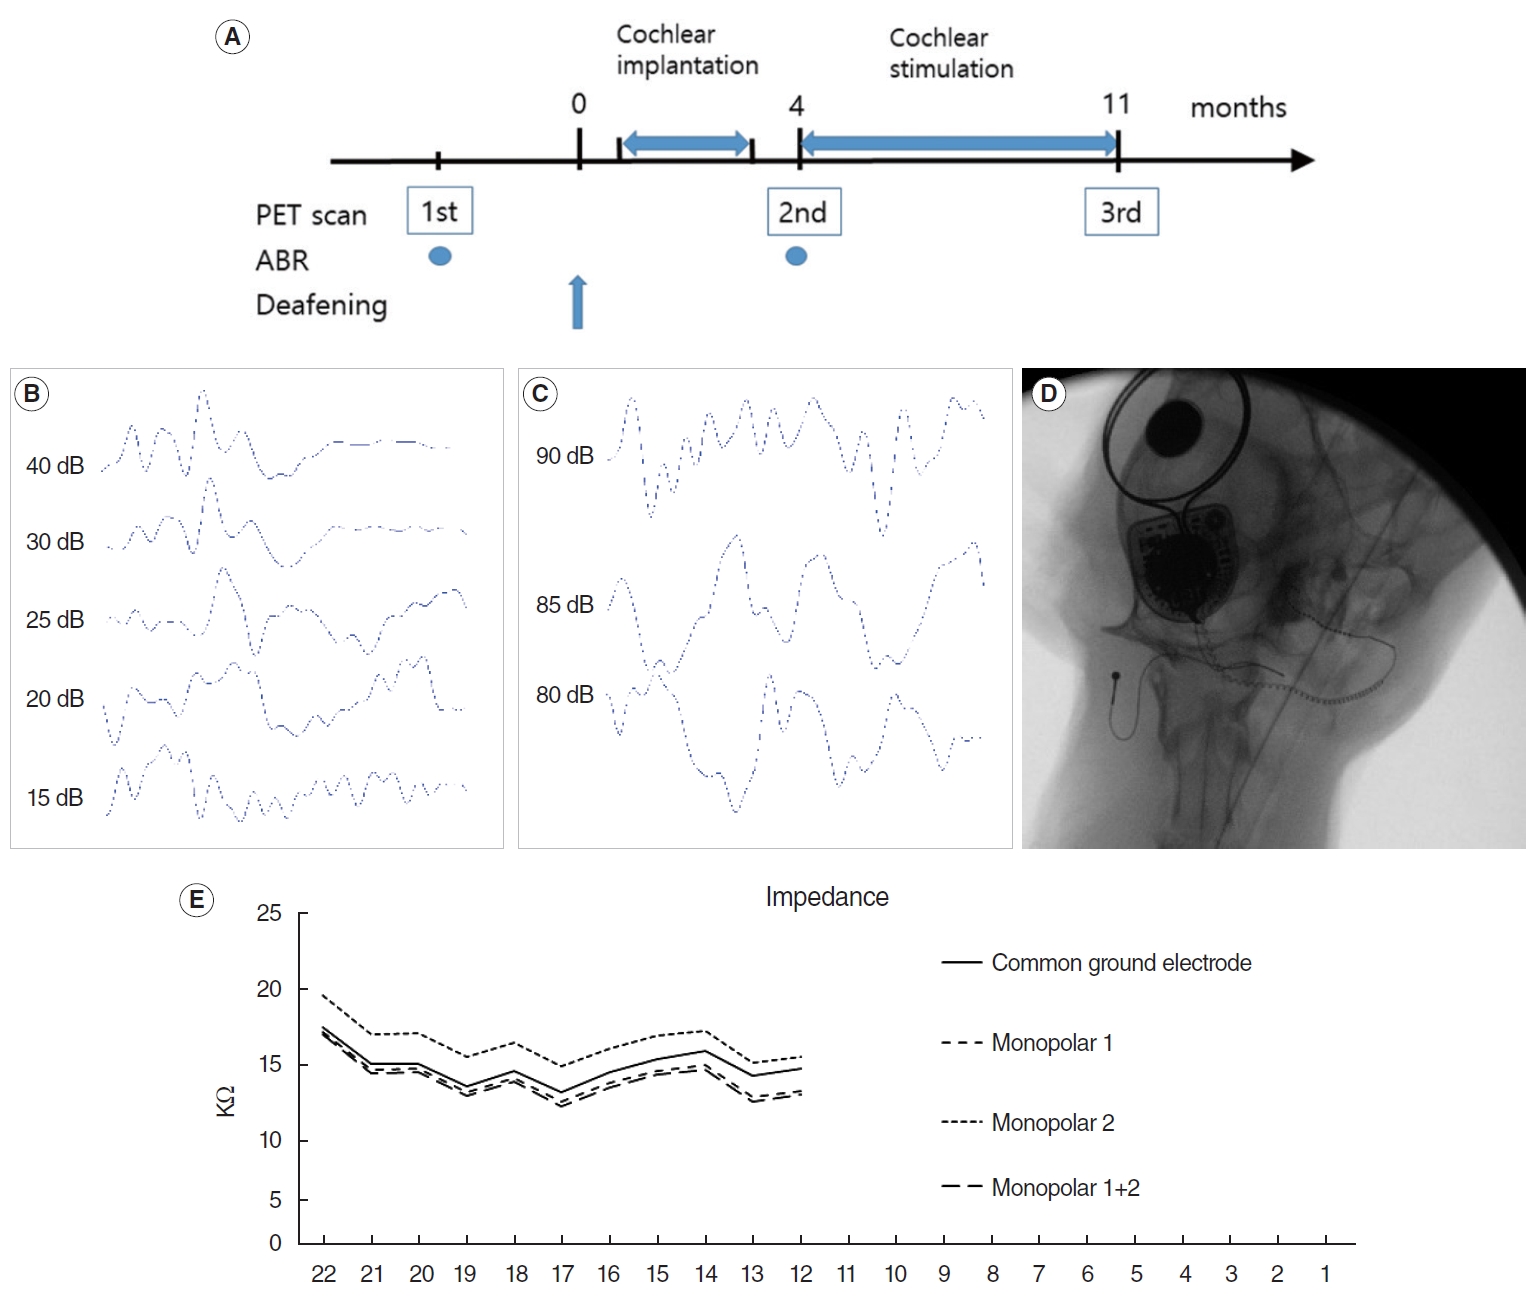
CI was performed in the right ear 3 months after the deafening procedure in the CI group (n=4) (Fig. 1A). A Nucleus 422 device (Cochlear Ltd.) was used for implantation. A retroauricular incision was performed under deep anesthesia using isoflurane. The bulla was exposed and opened using a drill. The round window (RW) was identified under microscopic view, and an incision was made to the RW membrane. The electrode was introduced slowly via the RW until resistance to the insertion occurred. The RW was sealed with soft tissue, and the electrode was fixed using fibrin glue. The ground electrode was located between the adjacent neck muscles. The internal device is located at the vertex area under the periosteum without bone drilling [23]. The wound was closed using subcutaneous and skin sutures. Impedance was checked and neural response telemetry (NRT) was performed. Postoperative radiography was performed to verify the electrode position.
Four months after the deafening procedure, electrical stimulation was started for 8 hours per day, 5 days per week. Environmental sounds, including voice, laboratory noise, and radio, were used for the stimulation. Mapping was performed using Custom sound 4.1 (Cochlear Ltd.) to determine the stimulation level every month during the stimulation period. Impedance was measured to check the electrode, and NRT was obtained monthly to determine the threshold level using the standard clinical settings in the program. Stimulation was based on measured T-NRT levels.
PET scan and image analysis
FDG-PET images were acquired using an Inveon scanner (Siemens Inc.). Images were acquired three times at the normal hearing state (before deafening procedure of baseline), 4 months after the deafening procedure immediately before electrical stimulation, and 11 months after the deafening procedure (7 months after stimulation for CI group). Before imaging acquisition, food was restricted for 8 hours. Anesthesia was induced by intramuscular injection of Zoletil (1 mg/kg), and 2% isoflurane in 100% oxygen (Forane solution; Choongwae Pharma) was used to maintain anesthesia during the image acquisition. FDG (1 mCi/kg) was administered intravenously. After 30 minutes of uptake, images were acquired for 40 minutes. Transmission PET data were acquired for 15 minutes for attenuation correction [24]. Emission list-mode data were sorted into three-dimensional (3D) sinograms and reconstructed using 3D reprojection algorithms. The image matrix was 128×128×159, the pixel size 0.77 mm×0.77 mm, and the slice thickness 0.79 mm. The image acquisition room had an environmental noise of 60 dB SPL. Facility lighting was purposely dimmed to prevent visual stimulation. Anatomical brain areas were determined using the magnetic resonance imaging-based cat brain atlas [25,26].
To identify the regional differences in cerebral glucose metabolism, voxel-wise statistical analysis using SPM 8 (http://www. fil.ion.ucl.ac.uk/spm) was used. For SPM analysis, the brain region of interest was extracted, and a study-specific brain template was constructed [27]. Individual PET data were spatially normalized by placing affine and non-linear transformations onto a study-specific brain template, and then overlaying them onto a study-specific brain template [27]. The voxel size of spatially normalized images was 0.3 mm×0.3 mm×0.3 mm. A 3-mm Gaussian smoothing kernel was applied to enhance the signal-to-noise ratio. Count normalization was performed.
PET image comparisons were performed between baseline and 4 months after deafening to evaluate the effects of HL to the central auditory system in both groups. Another comparison was performed between images of 4 months after deafening and those of 7 months after electrical stimulation to evaluate the effect of electrical stimulation in the CI group. Paired t-tests were used to identify regional differences between different time points within groups with a threshold of P<0.005 (uncorrected).
RESULTS
Deafening procedure
Baseline ABR showed that the thresholds were below 20 dB SPL in all animals (Fig. 1B). After the deafening procedure, all animals showed no response to 90 dB click sounds (Fig. 1C). This hearing level was confirmed by follow-up ABR 2 weeks later, with no response to the 90 dB SPL click sound in any animals.
CI and stimulation
The electrode array was introduced using an RW approach. The mean number of introduced electrodes was 11.5 (range, 10–14). Implantation was performed without any noteworthy events. Simple radiography showed that the electrode array was well introduced into the cochlea in all animals (Fig. 1D). The impedance data showed that each electrode state was normal (Fig. 1E). NRT was performed for all animals.
PET scans
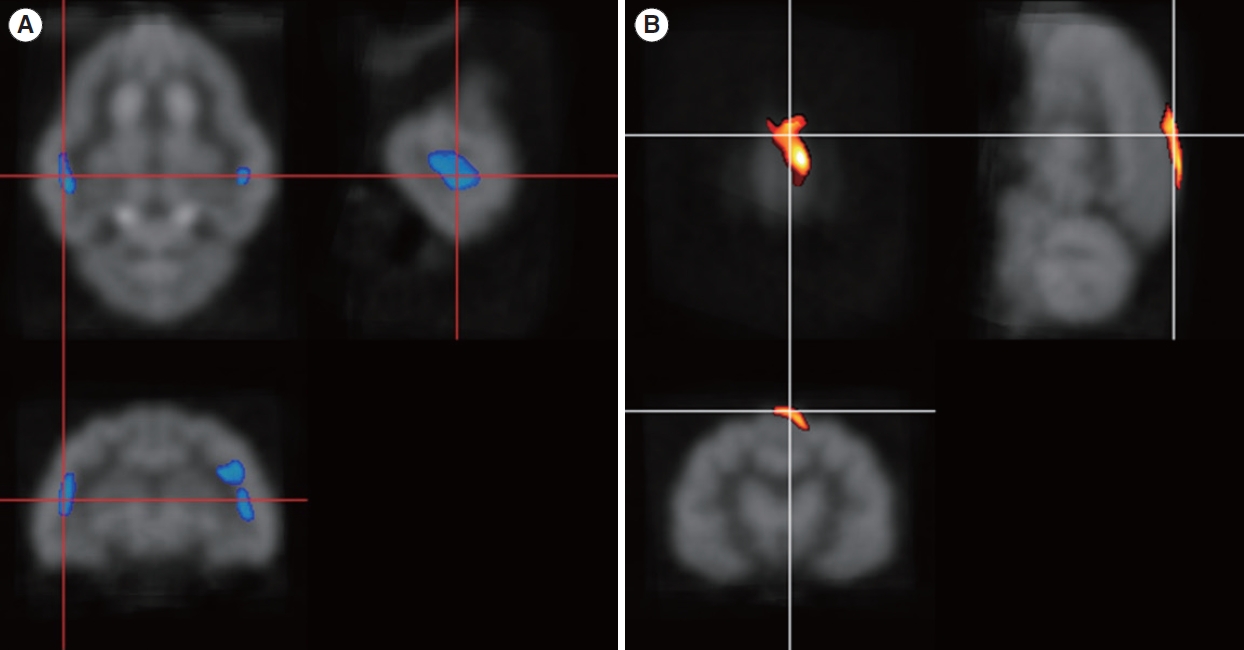
Four months after inducing deafness, glucose metabolism decreased in both primary auditory areas in both groups (Fig. 2A), and the suprasplenial gyrus (visual area 17) showed increased glucose metabolism (P<0.005) (Fig. 2B). This area is known as a visual-associated cortex [26]. After 7 months of electrical stimulation, glucose metabolism in the bilateral primary auditory cortical area improved, normalizing compared with the baseline of the normal hearing state (Table 1). The inferior colliculus (IC) showed decreased metabolism (Fig. 3A). This hypometabolism was not detected 4 months after deafness. The superior marginal gyrus still showed increased metabolism, and the cingulate gyrus showed hypermetabolism (P<0.005) (Fig. 3B).
DISCUSSION
This study aimed to show resting-state cortical activity after cochlear stimulation in an acquired deafness model. In this study, electrical cochlear stimulation restored glucose metabolism in the bilateral auditory cortices. A study using electroencephalography showed that cochlear stimulation rapidly improved bilateral auditory cortical activity in patients with postlingual deafness [1].
After deafness was induced, glucose metabolism decreased in both the auditory cortex and the IC. This pattern matches that of previous reports from humans and cats [2,10]. In this study, we found increased metabolism in the superior marginal gyrus 4 months after deafness. This area, which is known as visual area 17, is considered to be a visually associated area [26]. A previous report stated that this visual-associated area could be activated in compensatory changes [10].
Changes in glucose metabolism after CI have been previously reported in postlingually deaf humans. To evaluate the state of stimulation, glucose metabolism was compared between the switched-on and switched-off state of the cochlear implant in postlingually deaf patients. In that study, the bilateral auditory areas showed increased metabolism regardless of the implanted side, and increased metabolism was positively correlated with speech perception outcomes and negatively correlated with the duration of deafness [28-30]. This trend was also observed in prelingually deaf patients. Sound stimulation with a cochlear implant activates glucose metabolism in both auditory cortical areas [31].
An [15O]H2O PET study was performed to evaluate brain activity at rest, and that study showed increased blood flow in the right inferior occipital gyrus, extending to the inferior temporal region, and in the left posterior cingulate gyrus of experienced cochlear implant users [32]. Inexperienced cochlear implant users elicited more resting-state activities in the visual-associated cortex. This group also pointed out that a favorable outcome of CI depends on the intramodal compensation of the visual cortex and cross-modal reorganization of the superior temporal gyrus [2].
The IC showed metabolic changes after cochlear stimulation in this study. At 4 months after deafness induction, the IC areas had not changed significantly compared to baseline. However, the auditory cortical area showed less activation than baseline. This discrepancy between the auditory cortex and IC may result from the short duration of deafness. At 11 months after deafness, the IC showed significantly decreased metabolism, even with 7 months of electrical stimulation. The activity of the right IC was lower than that on the left side (Fig. 3A), which may have been because cochlear stimulation was performed on the right side, resulting in more stimulation to the left IC than to the right IC. However, to confirm this possibility, long-term stimulation and observation are necessary. In this study, IC changes followed those in the auditory cortical area.
After cochlear stimulation, we observed increased metabolism in the cingulate gyrus. The cingulate gyrus is considered to be a component of the default mode network (DMN) [33]. The DMN is known as a hypermetabolic area when the brain is in a resting state and not in task scan mode. The three major divisions of DMN in humans are the ventral and dorsal medial prefrontal cortex, the posterior cingulate cortex, and the precuneus [34]. DMNs have also been identified in other species, including monkeys [35], rats [36], mice [37], and cats [38].
Associations between the cingulate cortex and HL have been reported in several studies. Postlingually deaf patients showed significant decreased glucose metabolism in both anterior cingulate gyri, superior temporal cortices, and the right parahippocampal gyrus in a glucose PET study [8]. In older people with mild to moderate sensorineural HL and abnormal distortion product otoacoustic emission, the anterior and posterior cingulate gyri showed significantly lower cortical thickness than in people with normal hearing and distortion product otoacoustic emission [39]. In contrast, hypermetabolism of the cingulate gyrus was observed on PET in a study of profound HL patients, and the authors considered that this phenomenon was a compensatory mechanism for deafness to make individuals aware of the stimulation [32]. Another study showed dissociated functional coupling patterns in the anterior cingulate cortex and its subdivisions in patients with bilateral long-term sensorineural HL using resting-state functional magnetic resonance imaging. That study showed the connectivity between the cingulo-opercular network and the auditory network [40]. The cingulo-opercular network activity has been associated with higher levels of cognitive effort, and it was increased when listening in noisy conditions. Speech recognition is improved with elevated cingulo-opercular activity [41].
In our results, increased metabolism in the cingulate gyrus was considered evidence of DMN activation after cochlear stimulation. This suggests that the awareness level in a resting state was elevated after hearing restoration by the CI. The authors suggest that electrical cochlear stimulation can elevate the level of awareness in the resting state, and this could activate the DMN. Our study showed increased metabolism in the cingulate and supramarginal gyri after cochlear stimulation. These areas are considered to be DMN areas in humans. This observation indicates that cochlear stimulation activates and restores the DMN. To evaluate DMN activity accurately, PET scans should be performed in both switched-on and switched-off modes. This study did not acquire separate PET images according to the mode of the device, which is a limitation of this study. However, the CI group showed alterations in the DMN area after cochlear stimulation in the resting state.
HIGHLIGHTS
▪ After hearing loss, cortical activity of auditory area was decreased in glucose positron emission tomography images.
▪ After 7 months of auditory stimulation, the cortical activity of default mode network was increased.
▪ The auditory stimulation using cochlear implant elevated resting state awareness level in this animal experiment.