Music Perception Ability of Korean Adult Cochlear Implant Listeners
Article information
Abstract
Objectives
Although the cochlear implant (CI) is successful for understanding speech in patients with severe to profound hearing loss, listening to music is a challenging task to most CI listeners. The purpose of this study was to assess music perception ability and to provide clinically useful information regarding CI rehabilitation.
Methods
Ten normal hearing and ten CI listeners with implant experience, ranging 2 to 6 years, participated in the subtests of pitch, rhythm, melody, and instrument. A synthesized piano tone was used as musical stimuli. Participants were asked to discriminate two different tones during the pitch subtest. The rhythm subtest was constructed with sets of five, six, and seven intervals. The melody & instrument subtests assessed recognition of eight familiar melodies and five musical instruments from a closed set, respectively.
Results
CI listeners performed significantly poorer than normal hearing listeners in pitch, melody, and instrument identification tasks. No significant differences were observed in rhythm recognition between groups. Correlations were not found between music perception ability and word recognition scores.
Conclusion
The results are consistent with previous studies that have shown that pitch, melody, and instrument identifications are difficult to identify for CI users. Our results can provide fundamental information concerning the development of CI rehabilitation tools.
INTRODUCTION
Cochlear implants (CI) have provided tremendous benefit for speech recognition to patients with severe to profound hearing impairment for the last few decades. It is reported that over 100,000 people received CI surgery as of 2008 (1). In Korea, CI was introduced in the 1980's by Cochlear Corporation (Sydney, Australia) since then about 6,500 people with hearing impairments can hear through CI devices. While good speech communication within a quiet environment is generally achieved with current CI device, many CI listeners show a desire to hear various sound stimuli such as music (2).
Previous studies reported that rhythm discrimination of CI users is quite good but not as good as normal hearing listeners; however, they showed difficulty in perceiving pitch, melody, and timbre (3-5). There are a number of factors that affect accuracy of music perception. The number and condition of surviving auditory neurons, the processing capabilities of CI sound processor, and the depth of insertion of the electrode array can affect the amount of benefit they receive from their device (6, 7). Furthermore, individuals who have had a musical experience prior to their hearing loss may demonstrate a greater potential towards improving their music perception.
Most CI listeners reported that they are displeased with the sound quality of music post implantation (1). Current sound processing in CI devices is not optimal in transmitting musical stimuli because fine structure-temporal information and place pitch information are discarded in the processing of complex tones. Previous studies showed that ability regarding rhythm and instrument discrimination was equal in CI and hearing aid users, however, pitch ranking was better in the hearing aid users (8).
Recently, the development of music perception test batteries was reported by several researchers (9-11). Accordingly, some researchers suggested strategies in regard to enhancement of music perception such as bimodal condition and music training programs (8, 12). Despite a growing number of CI recipients in Korea, very few studies pertaining to music perception ability of Korean adult CI individuals have been reported. This study is aimed to assess functional ability of music perception which includes pitch, rhythm, melody, and instrument identification for Korean adult CI listeners and to provide fundamental information for CI rehabilitation.
MATERIALS AND METHODS
Subjects
Ten normal hearing (NH) and ten CI users participated in this study. CI listeners were post-lingually deafened adults 18-55 years of age (M, 30.0; SD, ±13.6). Their speech reception thresholds were equal to or better than 40 dB with implant experience from 2 to 6 years. Accordingly, ten age matched NH (M, 29.5; SD, ±14.6) listeners participated in this study as controls. They had pure tone air-conduction thresholds of 20 dB HL or better at octave and midoctave frequencies from 125 to 8,000 Hz. All participants had static acoustic admittance between 0.3 and 1.4 mmhos with peak pressure ranging between 100 and +50 daPa. Table 1 lists additional background information for the CI listeners. This study protocol was approved by the Institutional Review Board of Hallym University Sacred Hospital.
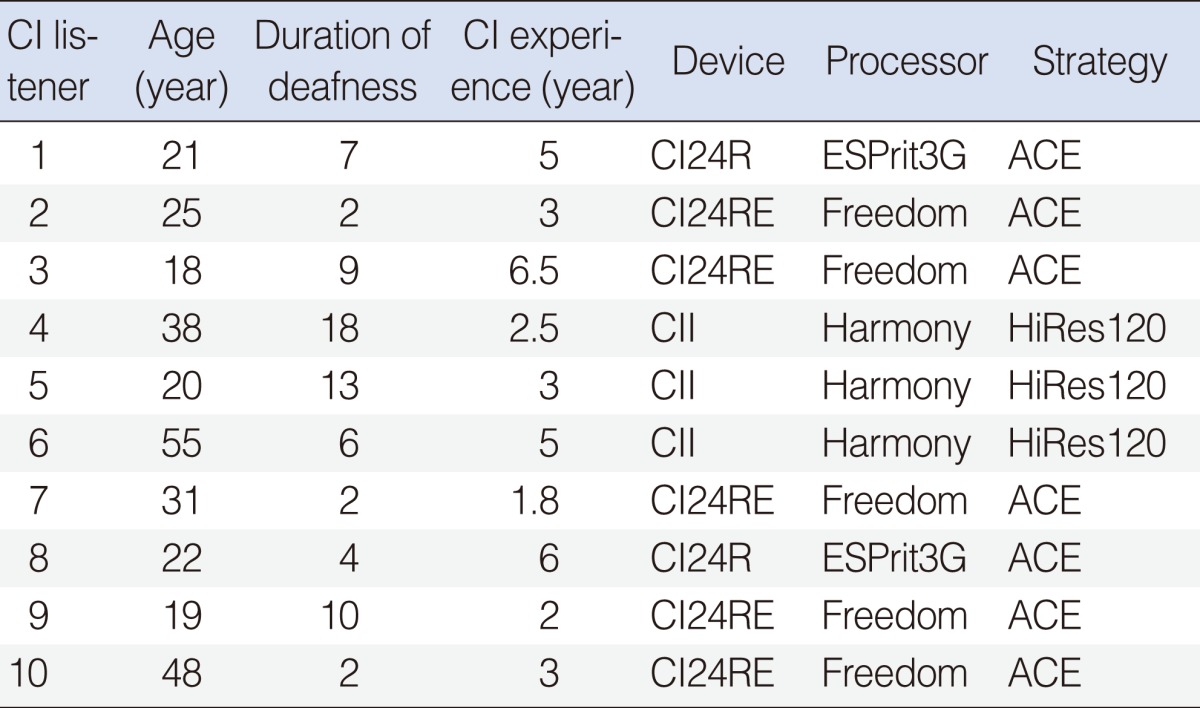
Demographic information of cochlear implant (CI) listeners
Test stimuli and procedure
Pitch discrimination
Digitally synthesized piano tones were used as stimuli for pitch discrimination. All tones were generated at the same amplitude with a 750 msec duration using Adobe Audition software (Syntrillium Inc., San Jose, CA, USA). Following four frequencies served as base frequencies; 185 Hz (F#3), 262 Hz (C4), 330 Hz (E4), and 391 Hz (G4). The minimum tested interval was 1 semitone up to 12 semitones (1 octave) from each base frequency. Pairs of tones were presented 3 times in random order. Then, subjects were asked to identify whether the two tones were the same or different.
Rhythm discrimination
Rhythmic stimuli were partially used from the subtest of those described in a previous fMRI study by Grahn and Brett (13). Stimuli were constructed with sets of five, six, and seven intervals with a total of 50 in this study. The intervals in the rhythms were related by ratios of 1:2:3:4 with the length of the "1" interval varying from 220 to 270 msec (in 10 msec steps) and the rest of the intervals were multiples of the 1 interval. Sine tones with six pitches varying from 294 to 587 Hz were randomly selected for each trial to help cue participants to each new trial. Participants listened to two presentations of a rhythm at a comfortable level and identified whether the two rhythms were the same or different.
Melody identification
In this subtest, participants were asked to identify the recordings of 8 common melodies from a closed set. Most frequently sung top 20 children's melodies were selected from the children's song websites as an initial list. Subjects were presented with the titles of the 20 melodies with their lyrics and then indicated their familiarity with each song on a scale of 0-10. The 8 melodies most familiar to all subjects were finally selected for final analysis. All melodies were composed of digitally synthesized piano tones which were 500-msec in duration at the same amplitude using Adobe Audition software. Table 2 lists the final 8 melodies with their frequency information.
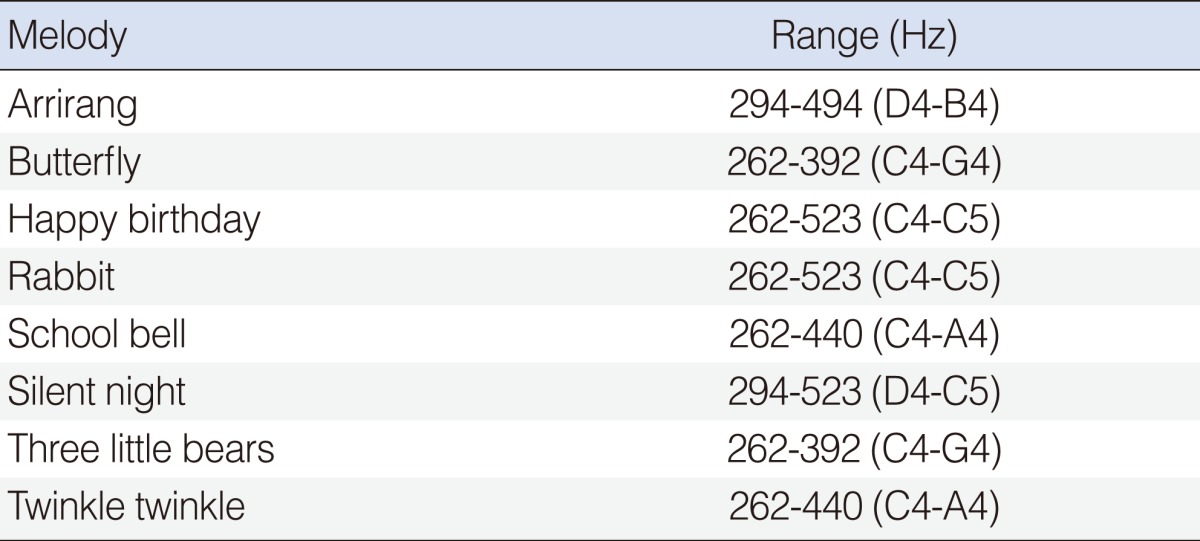
The eight familiar melodies selected for melody identification and their frequency ranges
Instrument identification
All listeners were presented with the name and the picture of 10 western instruments as they listened to the sound of each instrument. They were then asked to indicate their familiarity of each instrument from 0 to 10. The five most familiar instruments were selected and included in the final analysis. These instruments were piano and organ as pitched percussion, guitar and violin as string, and flute and saxophone as woodwind. The test stimuli consisted of recordings of 5 well-known musical instruments playing in a solo rendition. Each instrument sample was then presented 3 times in random order for recognition from a closed set.
Subjects were familiarized with each task through a practice section prior to testing. The subtests were presented at a comfortable level in a sound field for each subject. The percentage of correct responses was reported as the final score for all subtests.
Statistical analysis
Statistical analysis was performed using SPSS 14.0 (SPSS Inc., Chicago, IL, USA). A paired t-test was used to compare the mean scores between CI users and normal hearing controls. A Spearman analysis for the correlation between music perception ability and speech performance scores was used at a significant level of 0.05.
RESULTS
Pitch discrimination
With regards to the pitch discrimination subtest, the normal hearing group scored 96% (SD, ±3%) correct while the CI listeners scored 70% (SD, ±11%) correct. The CI group performed poorer than that of the NH controls in all four base frequencies (P<0.05). The mean difference limen (DL) for the base frequency of 185 Hz was 1.6 (SD, ±0.8) semitones, 1 semitone for 262 Hz, 1.1 (SD, ±0.3) semitones for 330 Hz, and 1.3 (SD, ±0.7) semitones for 390 Hz for NH group. Moreover, the CI group ranged from a minimum DL of 1 semitone to a maximum of 9 semitones at 185 Hz (M, 4.1; SD, ±3.0), 1 to 10 semitones at 262 Hz (M, 4.6; SD, ±3.2), and 330 Hz (M, 5.1; SD, ±3.0), and 1 to 5 semitones at 390 Hz (M, 2.8; SD, ±1.7) (Fig. 1).
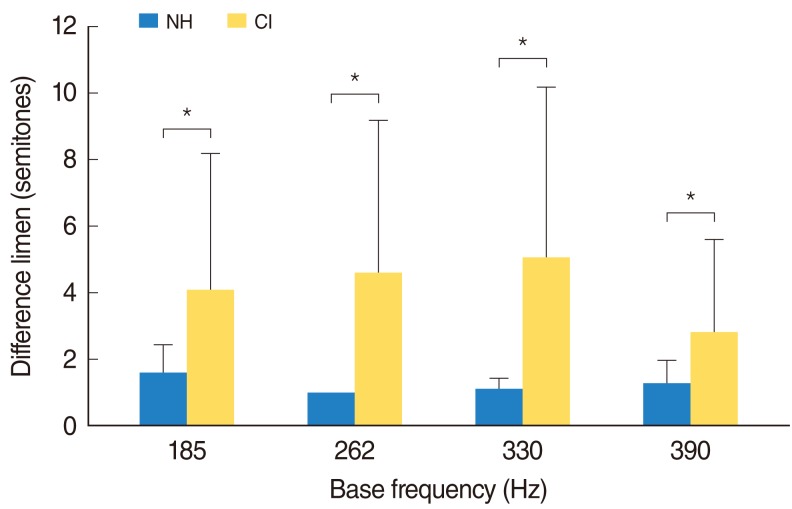
Mean semitones of pitch discrimination test in cochlear implant users (CI) and normal-hearing controls (NH). Difference limen refers to the minimum size of the interval for subjects to distinguish that they are different notes. *The significant difference between groups.
Rhythm discrimination
No significant differences were found between the NH and CI groups among different rhythmic intervals (P>0.05). Mean percent correct was 82% (SD, ±4%) for NH group and 77% (SD, ±12.3%) for CI group. Performances of 5, 6, and 7 intervals were 84% (SD, ±14.1%), 84% (SD, ±14.3%), and 77% (SD, ±17.2%) for NH group and 91% (SD, ±10.0%), 72% (SD, ±22.5%), and 68% (SD, ±17.0%) for the CI group, respectively. There was a significant difference in performance between 5 and 7 intervals in the CI group (P< 0.05) while no significant difference was found among different intervals within the NH group (Fig. 2).
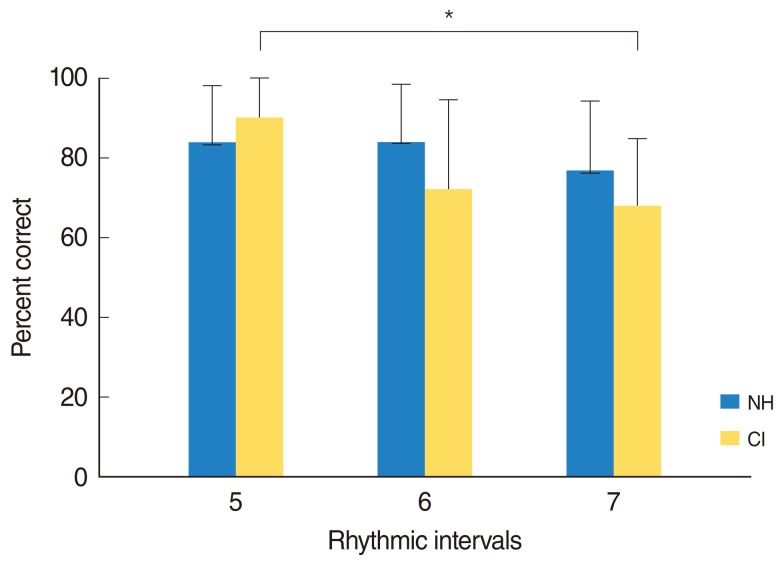
Percent correct of the rhythm subtest by group. NH, normal-hearing; CI, cochlear implant. *The significant difference between intervals.
Performances on the melody identification subtest ranged from 70% to 90% (M, 86%; SD, ±7.4%) correct for controls and 0% to 50% (M, 14%; SD, ±19%) correct for CI listeners. Normal hearing participants performed at a similar level throughout the songs. Significant differences were found in identifying all songs except 'School bell' between groups (P<0.05). 'School bell' showed the highest while 'Rabbit song', 'Happy birthday', 'Arrirang', and 'Silent night' were not identified by CI users. Fig. 3 shows the performance of the melody identification by group.
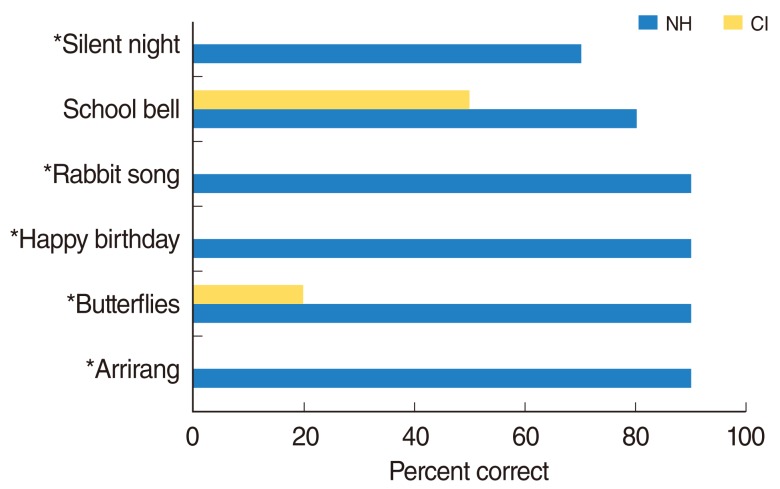
Performance of melody identification by group. NH, normal-hearing; CI, cochlear implant. *The significant difference between groups.
In the instrument identification subtest, NH participants scored 100% correct in identifying each instrument, however, performance of the CI listeners ranged from 22% to 78% (M, 56%; SD, ±21%) correct. CI listeners correctly identified the violin most well (78% correct), and the organ least well (22% correct). The organ was most often confused with the violin (33%), the piano with the saxophone (22%), the guitar with the organ (22%), and the flute with the violin (22%). Fig. 4 shows the performance of the instrument identification task by CI listeners.
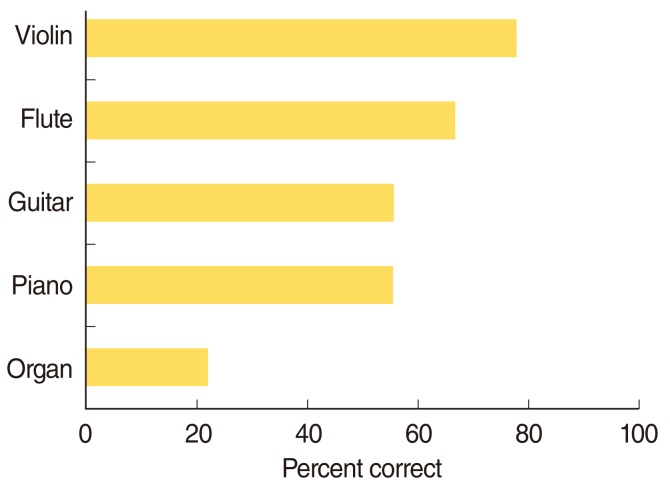
Percent correct responses by cochlear implant listeners for each instrument.
There were no significant correlations between music perception abilities and word recognition scores in CI users (P>0.05). In addition, no significant correlations were found between pitch, rhythm, melody, and timbre identification scores among CI users (P>0.05). Results of music perception ability for both normal hearing controls NH and CI users are shown in Fig. 5. There were significant differences between groups regarding pitch, melody, and instrument identification (P<0.05). However, no significant difference was found in rhythm subtest between NH and CI groups (P>0.05). Fig. 6 shows the percent correct of pitch, rhythm, melody, and instrument identification for each CI listener.
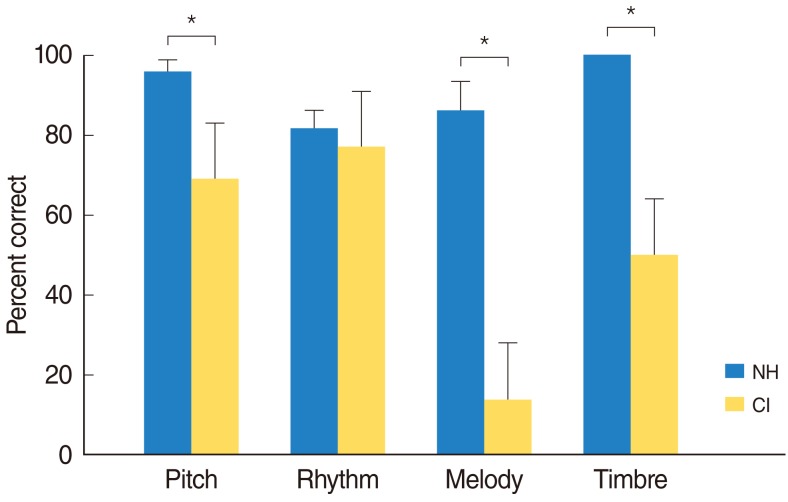
Mean performances of music perception ability by normal-hearing controls (NH) and cochlear implant (CI) users. The asterisk symbols represent the significant difference between groups.

Percent correct of pitch (square), rhythm (circle), melody (triangle), and instrument (diamond) identification for cochlear implant listeners.
DISCUSSION
Although the primary goal of the CI is to enhance speech communication, researchers have shown interest concerning how CI users perceive music. Previous studies reported that rhythm discrimination of CI users is quite good compared to normal hearing listeners; however, they show difficulty in perceiving pitch, melody, and timbre (3-5). Rhythm discrimination of CI users in our current study was consistent with previous studies in which rhythm discrimination ability was generally good but not quite as good in cochlear implant users as in normal hearing listeners. NH listeners performed at a similar level throughout different interval sizes, however, performance of CI users significantly decreased from 91% to 68% as the interval increased from 5 to 7. Burkholder et al. (6) indicated that the demands on memory and attention also increase as the complexity of a task increases. Kong et al. (5) reported that only one of the three CI listeners performed similar to normal hearing listeners while the other two listeners achieved 10% to 25% lower than that of normal hearing listeners. Although CI users showed perceptual accuracy similar to normal hearing listeners in rhythm discrimination within our study, they demonstrated some difficulty in performing a high-level rhythm task.
Pitch perception of CI users was significantly less accurate than that of normal hearing listeners. Normal hearing listeners demonstrated a perfect accuracy of perception by 1 semitone difference at a base frequency of 262 Hz (middle C). No differences were found between the four tested base frequencies although DLs increased from 185 to 330 Hz in the CI group. A recent study conducted for Korean CI listeners reported that pitch discrimination was better at lower frequencies (11). They reported that the mean DLs required for 262 Hz, 330 Hz, 390 Hz in CI listeners were 2.7±0.67, 4.37±0.94, 8.10±1.12 while 4.6±3.2, 5.1±3.0, 2.8±1.7 were obtained in our study, respectively. The smallest DL was shown at 390 Hz and 4.1±3.0 was obtained at the additional lower frequency in our study. Kang et al. (14) reported that no difference was found between the tested lower and higher base frequencies.
Melody perception in CI listeners was generally extremely poor even though familiar melodies were used. The mean performance with regards to normal hearing listeners was 86% but only 14% for CI listeners in our current study. In addition, 50% of the melodies were not identified at all by our CI listeners. All melody tones had an equal duration without rhythmic cues and lyrics which made the melody test more difficult in our study. Kong et al. (5) investigated the effects of rhythm in melody identification. They reported that CI listeners achieved about 63% in the rhythm condition and 12% in the non-rhythm condition whereas normal hearing listeners obtained about 98% in both rhythm conditions. Another study by Galvin et al. (15) reported a mean performance of 60% including rhythm but only 28% without rhythm for CI listeners. Melody identification seemed to be related to musical genre and its musical characteristics. For instance, 'Arrirang' which is a very famous folk song among Korean people is characterized by its various musical notes of different pitches between primary melodies. Such a highly rhythmic song regardless of its popularity might have been extremely difficult for our CI listeners without rhythmic cues and lyrics. It is suggested that highly rhythmic melodies seemed to be more difficult in recognizing melodies after removal of rhythmic cues.
A frequency range of the melodies may be another factor which affected melody identification. 'Silent night holy night' showed a relatively higher pitch range from 294 to 523 Hz compared to other tested melodies, as none of our CI users recognized the song. However, 'School bell' which scored the highest by CI listeners showed a relatively narrower frequency range from 262 to 440 Hz (Table 2). Moreover, after removal of the rhythmic cues, the test version of that song was quite similar to the original version in that, the CI listeners were able to recognize it easily.
A recent study reported a relatively low mean performance of 67% for NH listeners in instrument identification using the Korean version of the Clinical Assessment of Music Perception (CAMP) test (11). Instrument identification ability has been generally evaluated using western instruments, and some people in Asia may not be familiar with some instruments. We eliminated unfamiliar instruments for our subjects and assumed that this helped them perform a perfect score during the instrument identification tests. Other studies reported a similar result of above 90% for NH listeners but below 50% for CI listeners (3, 14, 16). Tested instruments identified correctly above 50% by CI listeners were violin, flute, guitar, and piano. Our confusion analysis indicated that violin was the easiest while the organ was the most difficult to identify. It was reported that percussive instruments such as guitar and piano were more easily identified than other instrument families such as wind and string instruments (3, 10). An instrument was distinguished by the temporal envelops and the spectral information of a sound, however, characteristics of music and a player's skill and style can affect results with regards to instrument identification.
Although current speech processors show deficiency in transmitting musical stimuli, several researchers reported effects of musical training in music perception (15, 17). Galvin et al. (15) reported that there was a significant increase in performance on a melodic contour identification test after training. Driscoll et al. (17) conducted a study for normal hearing listeners with regards to the effects of training on recognition of music instruments presented through cochlear implant simulations. They presented a degraded representation of each instrument in three training conditions: repeated exposure (without information or feedback), feedback (correct or incorrect), and direct instruction (instrument's name with its characteristics and feedback). Results indicated that effectiveness of different types of training vary as the direct instruction group showed the most improvement after training. Moreover, Looi and She (9) developed a music training program which consisted of 30-minute sessions done 2-3 times per week using a DVD format. Such effort towards the development of a music training program should no doubt improve music appreciation and enjoyment in combination with current CI technology.
The use of residual hearing may be an additional way to improve the music perception ability of CI listeners. If some apical hair cells are present, fine structure information at a low frequency can enhance ones music perception ability (1). Several researchers reported the impact of bimodal stimulation on music perception in CI listeners (18-20). Sucher and McDermott (19) reported that the melody recognition scores were higher with either bimodal or acoustic-alone stimulation than that of the implant-alone condition. With this in mind, bimodal stimulation provided significant improvements in music perception ability and the perceived sound quality of music when compared to results obtained with electrical stimulation alone. Kong et al. (18) also found that low frequency acoustic hearing produced significantly better performance in comparison to the electric hearing for melody recognition.
In conclusion, this study was aimed to compare music perception abilities of NH and CI listeners regarding Korean native adults. The results are consistent with previous studies that have shown that CI users have difficulty in identifying pitch, melody, and timbre efficiently. Our data will provide fundamental information in the development of CI rehabiliation tools for individuals with Korean speaking CI users. Future studies will be conducted to evaluate music appreciation and enjoyment of CI individuals with pre- and postlingual deafness in hopes of furthering their progress of music perception regarding pitch, melody and timbre identification.
ACKNOWLEDGMENTS
This research was supported by Basic Science Research Program through the National Research Foundation of Korea (NRF) funded by the Ministry of Education, Science and Technology (grant number 2010-0004427).
Notes
No potential conflict of interest relevant to this article was reported.