Development of Sound Field Audiometry System for Small Audiometric Booths and Comparison of Its Equivalence With Traditional System
Article information

Abstract
Objectives
Sound field (SF) audiometry tests are usually conducted in audiometric booths measuring greater than 2×2 m in size. However, most private ENT clinics carry about 1×1-m-sized audiometric booths, making SF audiometry testing difficult to perform. The aims of this study were to develop an SF audiometry system for use in smaller audiometric booths and compare its performance with traditional system.
Methods
The newly developed SF audiometry system can yield an SF signal at a distance of about 30 cm from the subject’s ears. Its height can be adjusted according to the subject’s head height. We compared SF hearing results between the new SF system and the traditional SF audiometry system in 20 adults with normal hearing (40 ears) and 24 adults with impaired hearing levels (38 ears) who wore hearing aids. Comparative parameters included warble tone audiometry threshold, a speech reception threshold (SRT), and a speech discrimination score (SDS). For statistical analysis, paired t-test was used. The equivalence of both SF systems was tested using two one-sided test (TOST) with a margin of 5 dB (normal hearing participants) and 10 dB (hearing aids wearing participants).
Results
Among participants with normal hearing, warble tone hearing thresholds of 0.5, 1, 2, and 4 kHz, average values of these four frequencies, and SRT were similar between the two systems (all P>0.05). Participants with hearing aids showed similar warble tone threshold and SRT (P>0.05) in both systems except for threshold of 4 kHz (P=0.033). SDS was significantly higher in the newly developed system (P<0.05). TOST results showed equivalent SF audiometry results using either system.
Conclusion
Audiometric results of the newly developed SF audiometry system were equivalent to those of a traditional system. Therefore, the small SF audiometry system can be used at small audiometric booths present in most private ENT clinics.
INTRODUCTION
Hearing impairment significantly affects the quality of daily life. Its prevalence increases with age. According to a study conducted in the United States from 2001 to 2010, an estimated 60.7 million people or approximately 22.7% of the total population aged 12 years and older showed hearing impairment. Its prevalence increased with age. Individuals in their forties, fifties, and sixties constituted 12.9%, 28%, and 45% of patients with hearing loss, respectively [1]. In South Korea, according to results of the Korea National Health and Nutrition Examination Survey performed from 2010 to 2012, the prevalence of hearing impairment was approximately 23%. It also increased with age [2].
Hearing impaired patients need assistive hearing devices such as conventional hearing aids, implantable hearing aids, cochlear implants, and so on. Sound field (SF) tests can be conducted using loud speakers. Such tests are necessary to evaluate functional hearing gain using assistive listening devices [3,4].
Currently, traditional SF audiometry systems in hospitals place two loudspeakers in 45° azimuth angles 1 m from the participant and noise (pure tone or warble tones) is delivered outside the audiometric booth through an audiometer so that participant’s response to the stimulus can be observed (Fig. 1). Since traditional SF systems use two fixed loudspeakers and place participant 1 m in front, big audiometric booths of 2×2 m are required. Therefore, most private ENT clinics that use smaller audiometric booths cannot apply such system.

Traditional sound field audiometry system installed in a large sized audiometric booth.
The purpose of this study was to develop an SF audiometry system for smaller audiometric booths and evaluate its performance compared to traditional systems by measuring SF hearing in normal-hearing participants and SF aided hearing in patients with hearing loss who wore hearing aids.
MATERIALS AND METHODS
The current study was approved by the Institutional Review Board of Chonnam National University Hospital (IRB No. CNUH-2019-046). Written informed consents were obtained from all participants.
Development of a SF audiometry system for small audiometric booths
In order to develop an SF system for small audiometric booths, head size and sitting height variation from children to adults need to be determined. To evaluate head size alterations, interaural length (IAL) and occipito-aural length (OAL) were measured via temporal bone computed tomography (TBCT) scans (Fig. 2A). Using TBCT scan image that could clearly show both sides of the auditory canal, IAL was measured as the distance between the beginning of both ear canals and OAL was measured as the distance from the occiput to the posterior wall of the ear canal. Among patients who underwent TBCT for various reasons, 20 patients of each sex in each age group of 5–10, 11–15, 16–20, 21–25, and 26–30 years old were randomly selected. A total of 200 patients undergoing TBCT were analyzed. To confirm incremental sitting height associated with age, parameters of height and sitting height corresponding to age recorded in the Korean Statistical Information Service were used for analysis.

Changes in head size with age. (A) Head size measurement using temporal bone computed tomography. (B) Changes in interaural length (IAL) with age. (C) Changes in occipito-aural length (OAL) with age.
Based on obtained data, the system was configured so that the speaker could move up and down according to seat height of the subject. To keep the distance between the speaker and subject’s ears constant, the system was also designed so that headrest and arm could be adjusted according to subject’s head size.
Comparison of SF audiometry equivalence in participants with normal hearing using the newly developed SF system and the traditional SF system
For a comparative analysis of SF hearing thresholds in normal hearing participants, SF examination was conducted using the newly developed SF system and the traditional SF system. Twenty adults (40 ears) underwent SF audiometry. The male-to-female sex ratio of the normal hearing group was 9:11 with an average age of 32.9±6.2 years. Testing was performed after inspecting both external auditory canals with an otoscope. With the traditional SF system, warble tone audiometry at 0.5 kHz, 1 kHz, 2 kHz, and 4 kHz was conducted. The same procedures were used for the newly developed SF system. The traditional SF system employed an audiometer (Madsen Orbiter 922) and connected amplifier along with two loud speakers in a 2×2-m-sized audiometric booth. The newly developed SF system used an audiometer (R27A Resonance) and a connected amplifier (R150Plus; Inter-M, Seoul, Korea) and two loud speakers (Minx Min 12; Cambridge audio, London, UK) in a 1×1-m-sized audiometric booth. All audiometric devices were calibrated before the test.
Comparison of SF audiometry equivalence in hearing aid-wearing patients using the newly developed and traditional SF systems
To evaluate whether SF aided hearing measurements were equivalent between the newly developed SF system and the traditional SF system in patients wearing hearing aids due to hearing impairment, 24 adults (38 ears) underwent SF aided audiometry. There were 15 males (23 ears) and nine females (11 ears) with an average age of 57.5±17.2 in hearing aid-wearing patients with hearing loss. After ascertaining the absence of hearing aids malfunction, SF aided warble tone audiometry at 0.5, 1, 2, and 4 kHz, speech reception threshold (SRT), speech discrimination scores (SDS) at 65 dB HL, and most comfortable loudness (MCL) were obtained under the traditional SF system. The same methods were applied to the newly developed SF system.
Statistical analysis
A paired t-test was used to compare the traditional SF system and the newly developed SF system, with a P<0.05 indicating significant difference. Equivalence of the two systems was analyzed using two one-sided test (TOST) with a margin of 5 dB (participants with normal hearing) and 10 dB (participants with hearing aids) to determine statistical significance at 90% confidence interval.
RESULTS
Head size, height, and sitting height changes with age
TBCT measurement results showed average head sizes of 14.2 cm and 13.6 cm in IAL for 5–10-year-old males and females, respectively. The IAL increased to an average of 16.1 cm and 15 cm in 21–25-year-old males and females, respectively (Fig. 2B). The minimum IAL of patients aged 5–30 years was 12.7 cm while the maximum IAL was 17 cm, with difference not exceeding 4.3 cm (Table 1). Average OALs of patients in 5–10-year-old groups of males and females were 6.9 cm and 6.8 cm, respectively. Average OALs of males and females in 21–25-year-old group were 7.9 cm and 7.4 cm, respectively (Fig. 2C). The minimum and maximum OALs of patients aged 5–30 years were 5.6 cm and 9.4 cm, respectively, with difference not exceeding 3.8 cm (Table 1).

Changes in head size with age
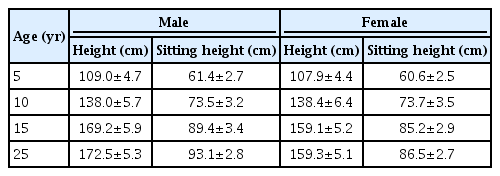
According to the 2016 Korean Statistical Information Service (KOSIS), average heights of 5-year-old males and females were 109.0±4.7 cm and 107.9±4.4 cm, respectively. Those of 25-year-old males and females were 172.5±5.3 cm and 159.3±5.1 cm, respectively. Average sitting heights of 5-year-old males and females were 61.4±2.7 cm and 60.6±2.5 cm, respectively. Average sitting heights of 25-year-old males and females were 93.1±2.8 cm and 86.5±2.7 cm, respectively. Since SF audiometry was performed in a sitting position generally, there was a difference of approximately 30 cm in height (Table 2) [5].
Development of SF audiometry system for a small audiometric booth
Based on age-related differences in head size and sitting height, we developed an SF audiometry system to adjust longitudinal placement of loud speakers close to the participant’s ear 30 cm in the front at a 45° azimuth angle (Fig. 3). Also, we could adjust loud speakers’ height according to patient’s sitting height. When output difference between the newly developed system and the traditional system was investigated, different output was shown for each frequency. Generally, there was a gain of about 6 dB or more in output at 30 cm when compared to that at 1 m (Table 3).
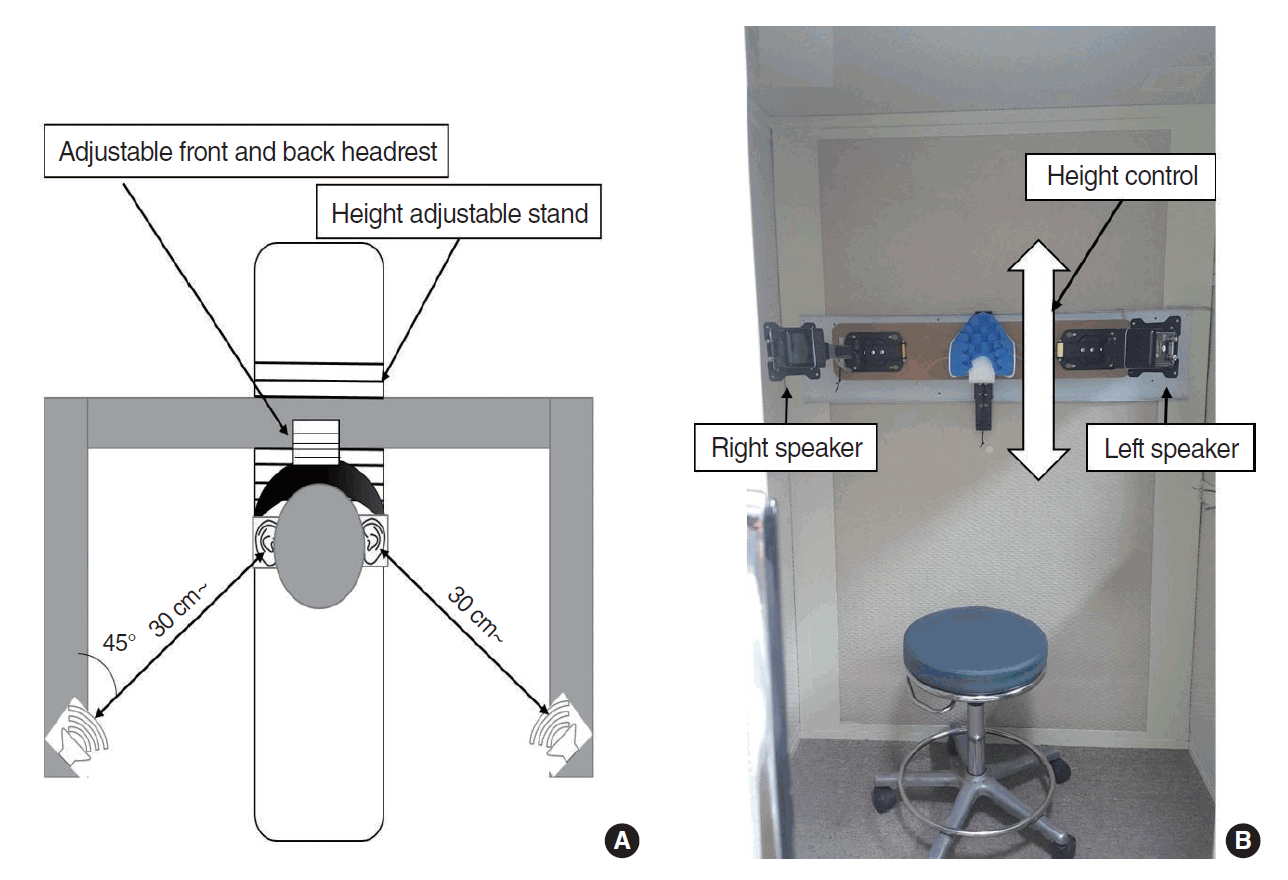
Newly developed sound field audiometry system for small audiometric booths. (A) Schematic. (B) Newly developed sound field audiometry system installed in a small audiometric booth.
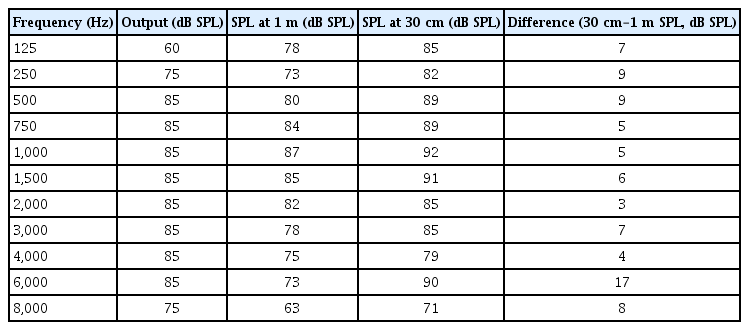
SPL difference according to the distance
Equivalence of SF audiometry results with the newly developed and traditional SF systems in participants with normal hearing
Warble tone audiometry using the traditional SF system and the newly developed SF system in participants with normal hearing yielded an average of 11.1 and 10.6 dB at 0.5 kHz, 9.0 and 7.6 dB at 1 kHz, and 7.0 and 6.1 dB at 2 kHz, and 5.5 and 2.0 dB at 4 kHz, respectively (P=0.659, P=0.251, P=0.484, and P=0.106, respectively). Average warble tone thresholds with the four frequencies [(0.5 kHz+2×1 kHz+2×2 kHz+4 kHz)/6] resulted in 8.1 and 6.7 dB each (P=0.136) (Fig. 4A). Furthermore, SF audiometry analysis using TOST of the two systems yielded equivalent results with a margin of 5 dB at each frequency within 90% confidence intervals (Fig. 4B).
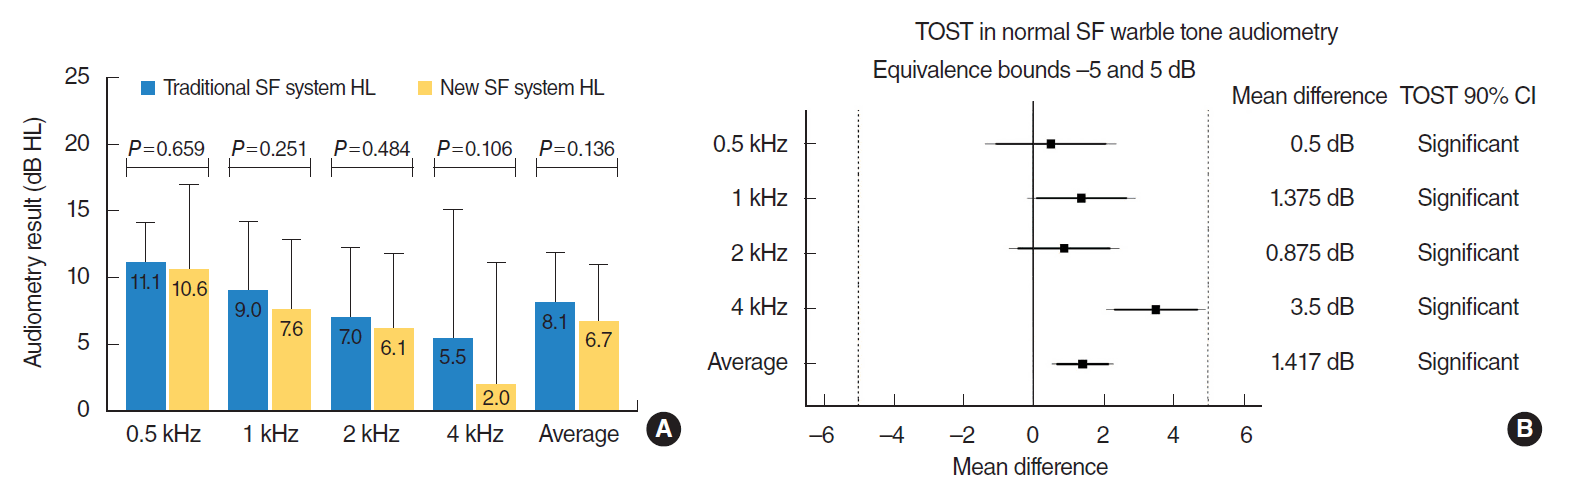
Comparison of sound field (SF) warble tone audiometry results of participants with normal hearing under traditional and newly developed SF systems. (A) Comparative hearing thresholds in both SF systems. No significant difference was detected at 0.5, 1, 2, 4 kHz, or average warble tone hearing threshold (paired t-test). Average refers to six-frequency average hearing thresholds [(0.5 kHz+2×1 kHz+2×2 kHz+4 kHz)/6]. (B) Results of two one-sided test (TOST) showing equivalent SF audiometry results under the two systems within 90% confidence intervals (CIs) at a margin of 5 dB for each frequency. Error bar: standard deviation.
Equivalence of SF audiometry results with the newly developed and traditional SF systems in hearing loss patients with hearing aids
Average warble tone audiometry results of patients wearing hearing aids using the traditional and newly developed SF systems were 42.9 and 41.4 dB at 0.5 kHz, 38.3 and 36.3 dB at 1 kHz, 41.6 and 41.2 dB at 2 kHz, and 54.6 and 47.4 dB at 4 kHz, respectively (P=0.636, P=0.437, P=0.873 and P=0.033, respectively). Average warble tone hearing thresholds under four frequencies were 42.9 and 40.6 dB each (P=0.287). SRT values were 49.2 dB and 48.2 dB, respectively (P=0.636). Except for 4 kHz, there was no statistical difference between the two systems at any frequency (Fig. 5A). Also, analysis of SF audiometry results using TOST of the two systems showed equivalent findings within 90% confidence intervals at a frequency margin of 10 dB (Fig. 5B). SDS test results with the traditional and newly developed SF systems were 59.2% and 71.5% (P=0.031), respectively, on 65 dB HL and 78.4% and 85.5% (P=0.048), respectively, on MCL. The newly developed SF system showed better speech discrimination on both levels (Fig. 5C).
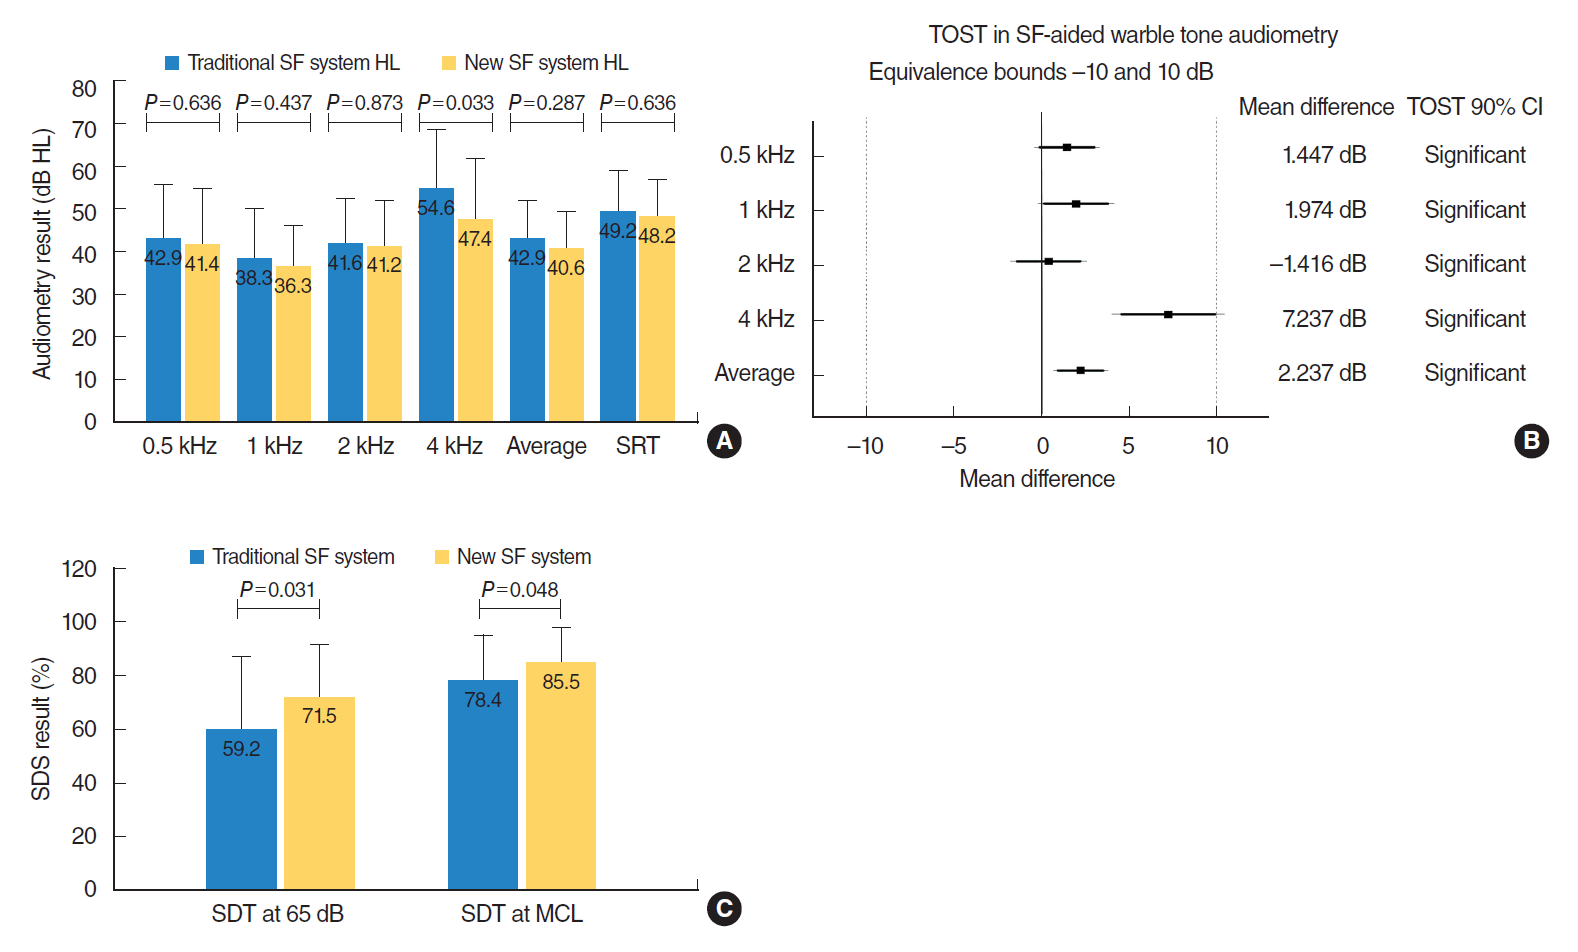
Comparison of sound field (SF)-aided warble tone audiometry results among patients wearing hearing aids under traditional and newly developed SF systems. (A) Comparative hearing thresholds in both SF systems. No significant difference was found at 0.5, 1, 2 kHz, or average warble tone threshold, or speech reception test thresholds (paired t-test). (B) Results of two one-sided test (TOST) showing equivalent SF aided audiometry results under the two systems within 90% confidence intervals (CIs) at a margin of 10 dB for each frequency. (C) Measures of speech discrimination score (SDS) at 65 dB HL and maximum comfort level (MCL) under both SF systems. The SDS of the newly developed SF system was higher than that of the traditional SF system (P<0.05, paired t-test). Error bar: standard deviation. SDT, speech discrimination test.
DISCUSSION
SF audiometry is performed in a similar manner as the conventional pure tone audiometry. After the required booths is fully set up, the measurement is relatively easy. SF audiometry has been the most frequently used method for fitting of hearing aid and technical verifications. However, compared with real ear measurement (REM), the examination can be subjective with questionable reliability of hearing thresholds and relatively long periods of time. In addition, the test can be hard to perform in infants. Moreover, procedures entail masking of the contralateral ear. In terms of 95% confidence interval of test reproducibility, the REM was 3 dB [6,7] while the SF was approximately 15 dB [8], suggesting that REM was a more reliable test [9]. Nevertheless, SF audiometry is recommended for the following reasons.
First, pure tone audiometry with headphone cannot represent real-world hearing conditions even if acoustic coupler has been effectively used. Conversely, SF audiometry is based not only on sound, but also on auditory spatial characteristics, thereby reflecting clinical reality. Also, pure tone can be attenuated by feedback control and noise suppression algorithm via hearing aids while warble tone in SF audiometry avoids these distortions [10].
Second, although most patients with hearing aids currently use REM compared with functional gain measurement, REM cannot be performed for patients with bone-anchoring hearing aids or cochlear implants. Additionally, REM can be used to measure functional gains under very limited frequencies without characterizing input/output function of the aid or providing an accurate analysis of hearing aid performance during conversational speech. Also, a few patients cannot tolerate the REM procedure [11].
Therefore, SF audiometry can be used for fitting hearing aids. However, the setting of an SF testing facility is much more complex than that for conventional audiometry. In addition, patient’s head position, placement of the loudspeaker, and so on can affect sound pressure levels and eventually audiometry results [12]. Therefore, international standards stipulate the criteria for comprehensive settings (in Korea, KS I ISO 8253-2 and KS I ISO 389-7). The ISO 8253-2 specifies relevant test signal parameters, requirements for SFs, and SF audiometry procedures using test signals and results [13]. The ISO 389-7 specifies a reference hearing threshold for calibration of audiometric equipment used under specific SF. Based on these standards, adequate acoustic characteristics of the room, placement of loud speakers, and reference level for acoustic signal and frequency response in SF need to be laid out [14].
To perform SF audiometry in small-sized audio booths, the standard 1 m distance between the patient and the speaker is shortened to fit the space. To satisfy this condition, the size of the loudspeaker is minimalized while keeping the distance between patient’s ear and the speaker constant (their heights should be at the same level). Since SF audiometry is performed mostly in a sitting position, seated height differences between children and adults (height adjustment of the speaker) and head size differences between children and adults (back and forth, right and left adjustment of the speaker) should be considered with appropriate adjustments. In this study, head size alterations in the right or left side in participants 5–30-years-old were analyzed and a maximum IAL difference of 2 cm and a maximal OAL difference of 4 cm were found. Also, sitting height variation between 5- and 25-year-old participants was approximately 30 cm. Therefore, we designed a device to adjust head size and sitting height to align patient’s ear with speakers’ height. Through this device by placing patient’s head on a headrest, SF audiometry can be conducted at a constant calibrated distance.
In the group of participants with normal hearing, equivalence of traditional and newly developed SF system was established using SF audiometry at 0.5, 1, 2, and 4 kHz with warble toned in both systems. No statistically significant difference was found between the two systems. Equivalence analysis using TOST with a delta value of 5 dB suggested that all four frequencies showed equivalent SF audiometry results in participants with normal hearing. Analysis of aided hearing threshold which was the main purpose of this study showed three equivalent frequencies except for 4 kHz, with an average hearing level SRT in both systems. Also, equivalence analysis using TOST with a delta value of 10 dB showed that all four frequencies and the average hearing level were equivalent in both systems in the group with hearing aids. Surprisingly, SDS was significant better with the newly developed SF system on both 65 dB and MCL tests. Usually, when patients perform speech discrimination tests on SF with hearing aids, results tend to show lower discrimination scores than expected. Speech discrimination could be affected by reverberation which can be affected by the strength of SPL. To obtain the same hearing level, the newly developed SF systems requires a lower SPL level than the traditional SF system. This might have led to the better SDS results than the traditional SF system.
Audiometric results of the newly developed SF audiometry system for small audiometric booths provided equivalent hearing test results to those of a traditional SF audiometry system. Therefore, the newly developed SF audiometry system can be set up in small audiometric booths built in ENT clinics (the majority of the cases) with results equivalent to traditional SF audiometry systems.
HIGHLIGHTS
▪ We developed a sound field (SF) audiometry system for small audiometric booths.
▪ SF audiometry results of the newly developed SF audiometry system for small audiometric booths were equivalent to those of traditional system.
▪ Speech discrimination score with the newly developed system was significantly higher than that of the traditional system.
▪ The newly developed SF audiometry system can be set up in small audiometric booths built in ENT clinics.
Notes
No potential conflict of interest relevant to this article was reported.
AUTHOR CONTRIBUTIONS
Conceptualization, Methodology, & Project administration: HHC, SL. Data curation, Formal analysis, & Visualization: YMC, EJK. Writing - original draft, review & editing: EKJ, HHC.
Acknowledgements
This research was supported by a grant (NRF-2016R1D1A1-A02937094) of the Basic Science Research Program through the National Research Foundation (NRF) funded by the Ministry of Education, Science and Technology, Republic of Korea.