Electroacoustic Evaluation of Smartphone-Based Hearing Aid Applications
Article information
Abstract
Objectives
This study evaluated the electroacoustic characteristics of smartphone-based hearing aid applications (apps).
Methods
We investigated hearing aid apps based on processing delay measurements, hearing instrument testing, simulated real ear measurements, and a head-and-torso simulator.
Results
Many apps exceeded the recommended level for processing delay. Hearing instrument testing showed the highest amplification characteristics and the best sound quality when a hearing aid was used, followed by the high-end apps and then the low-end apps. The simulated real ear measurements results showed that the high-end apps had a better ability to match the amplification targets than the low-end apps, but there was no consistent pattern among apps when controlling the output. Only a few apps could improve the signal-to-noise ratio in the head-and-torso simulator.
Conclusion
Most of the apps showed relatively poor electroacoustic performance in comparison with hearing aids. Generalizing access to hearing care through hearing aid apps induces a wide diversity of hearing performance with no fixed standard for reliability. However, we expect their overall quality to improve over the next few years.
INTRODUCTION
Diverse solutions are being developed to reach larger numbers of hearing-impaired people. Smartphone-based hearing aids and hearing amplifier application (apps) attempt to amplify normal hearing or improve the audibility of sounds in hearing-impaired individuals using algorithms similar to those used by classic hearing aids. The main advantage of these apps is their accessibility, as they are either free or require a subscription after a free trial. These apps, which allow users to access hearing amplification through earbuds, fall into several categories to suit the needs of different users; some have basic features, such as adjustable amplification, an equalizer, and sometimes noise reduction (NR), while others include options such as self-audiometry via earbuds. Their accessibility, ease of use, and the fact that they run on smartphones (using their battery and signal processing power) may make them useful to a significant proportion of hearing-impaired individuals who are not ready to invest in hearing aids.
Apps are a fairly recent development, and their use is not currently widespread. Few studies have examined their sound quality or investigated their benefits. Numerous methods and parameters are available to evaluate the sound quality of a hearing device. The commonly used standards described by the American National Standards Institute [1,2] and the International Electrotechnical Commission [3] are used to check the specifications of hearing aids as described by their manufacturers. These references have already been used for electroacoustic analysis of direct-to-consumer hearing devices [4], including some hearing aid apps [5]. Sound quality parameters related to the hardware or to certain features of apps were also investigated. Medwetsky et al. [6] studied the influence of the earbuds used with a smartphone and De Sousa et al. [7] analyzed the processing delay and the signal-to-noise ratio (SNR) improvement achieved with the NR feature.
However, those studies showed that there were many perceptible differences among the different apps, with some attempting to be as close as possible to what a hearing aid can provide, while others position themselves only as basic hearing amplifier apps. Moreover, few apps have been investigated, which makes it difficult to draw generalizable overall conclusions about their benefits. Therefore, it would be valuable to provide a wider overview of existing apps by defining a number of characteristics through a framed electroacoustic analysis. This would give a more accurate idea of how well hearing care can be provided by current hearing aid apps when no fixed standards for apps to meet have been determined.
The aim of this study was to explore the usability and sound quality of the hearing aid apps that have been officially released at the time of writing based on electroacoustic measurements made from diverse sources and studies.
MATERIALS AND METHODS
Hearing aid apps, devices, and test equipment
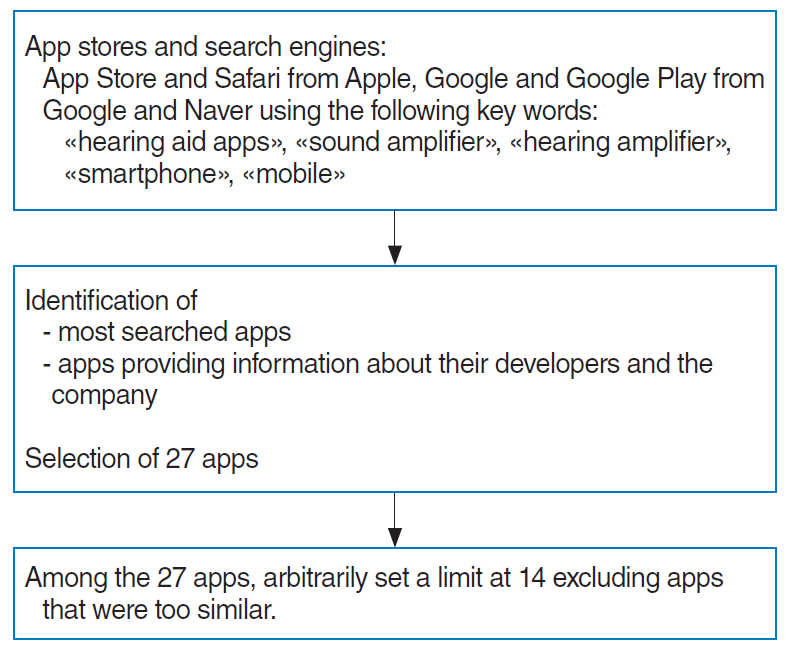
Three authors independently searched for hearing aid apps with the aim of providing information on the apps most likely to be found and used around the world, we selected 14 among a total of 27 apps initially identified (Table 1, Fig. 1). Apps equipped with amplification based on a user’s audiogram or self-hearing test and a sufficiently low processing delay (<30 ms) [8] were considered “high-end,” while the rest were considered “low-end.” We used an iPhone 8 (Apple Inc., Cupertino, CA, USA) for iOS apps, a Galaxy S8 (Samsung, Seoul, Korea) for Android apps, and two wired earbuds with built-in microphones provided with the smartphone by each manufacturer: Apple A1748 EarPods with lightning connector and Samsung EO-IG955 earbuds tuned by AKG. We also used a pair of wireless earbuds (AirPods Pro, Apple Inc.) to assess processing delay of the 10 hearing aid apps that provided Bluetooth-enabled versions. For the hearing aid, we tested the Siya 1 miniRITE coupled with two 85 dB receivers and single closed ear tips (Oticon, Smorum, Denmark).
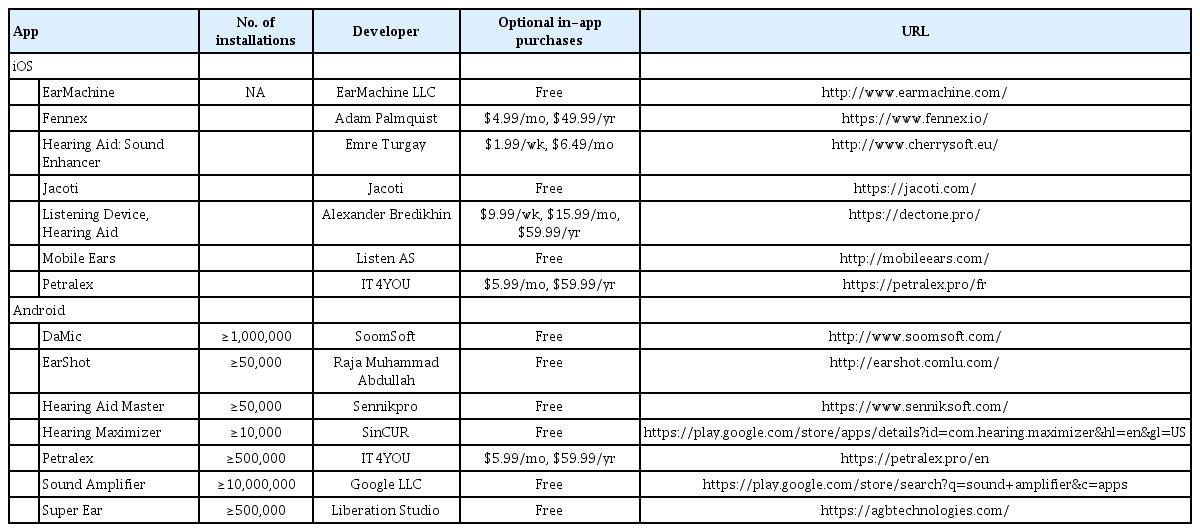
Hearing-aid apps used in the study, listed by mobile operating system, number of installations, developer, and in-app purchase information
Processing delay measurement
We assessed the processing delay of hearing aid apps using three click sounds (centered at 500 Hz, with an interval of 1 second) generated and recorded on Audacity software (ver. 2.3.3). The signals were presented and recorded through headphones (Cloud 2; HyperX, Fountain Valley, CA, USA). The clicks were presented via the headphones at high volume, and the headphones’ microphone immediately recorded the presented sound. The microphone of the earbuds (connected to the smartphone) was placed between the Cloud 2 headphones, and the output was placed next to the headphones’ microphone. Therefore, the clicks were each recorded twice. The first occurred immediately after presentation. The second was first recorded by the microphone of the smartphone, processed by the app, and then presented by the earbud to the headphones’ microphone. The processing delay was calculated in MATLAB (R2019a; MathWorks, Natick, MA, USA) using a correlation function, yielding the time between the first and second recordings of the click. The operation was conducted for three clicks, and the average was used in the analyses.
Hearing instrument testing
The hearing instrument testing (HIT) and simulated real ear measurement (S-REM) were performed using Affinity 2.0 software (ver. 2.6.0; Interacoustics, Middelfart, Denmark). One of the earbuds connected to the smartphone was linked with adhesive putty (Blu Tack; Bostik, Colombes, France) to a 2-mL coupler (HA-1). To ensure reliability of the results, measurements were performed twice in succession. The high-frequency average (HFA) of each hearing aid app was measured at three frequencies, i.e., 1, 1.6, and 2.5 kHz. We measured the amplification characteristics through the HFA full on gain (FOG) and output sound pressure level (OSPL)90, which correspond to the outputs of 50 dB SPL and 90 dB SPL inputs, respectively. Then, we explored the sound quality with high-frequency peaks and other parameters, such as equivalent input noise (EIN) and total harmonic distortion (THD). The volume of the smartphone was always set to 100%, and the gain control on the apps was set to 100% to measure FOG and OSPL90 and was modified for the THD and the EIN when the reference test setting was applicable. All features offered by the apps were deactivated to be as close as possible to the “raw” characteristics of the apps and devices.
Simulated real ear measurement
After the HIT, eight of the 14 hearing apps were selected for the S-REM. The rest of the apps were unsuitable for subsequent S-REM due to excessive delays in processing and low output or non-compatibility with the measure. We used the HA-1 2-mL coupler in the S-REM to measure the output from the tested devices in response to an input. The S-REM in this study followed the procedure described by Voss et al. [9]. The amplification targets were produced according to the audiometric configurations entered into the software. We chose the NAL-NL2 prescribed gain target and the international speech test signal (ISTS) [10] used as the input of the REAR measure. We used four audiometric configurations: three mild hearing loss audiograms (low frequency, high frequency, and flat), and one moderate hearing loss audiogram, which was used to check whether the apps met the requirement indicated by the targets. The apps were tested using two gain configurations. The first was designed for first-fit conditions. The smartphone was set at 100%, while the gain control on the app was set at 50%. The second configuration was intended to reflect the maximum potential of the apps to match the desired targets. Therefore, based on the previous measured output, we manually adjusted the gain control and parameters of the apps to match the targets. For the hearing aid, the first fitting corresponded to the first amplification after recording the audiogram with the software, and the amplification was not modified. Following the British Society of Audiology [11], we measured the output with 50 dB SPL and 65 dB SPL inputs, and the tolerance values for the target matching were set at ±5 dB from 250 Hz to 2,000 Hz and at 8 dB at 3,000 and 4,000 Hz, which we extended to 6,000 Hz. We controlled the target matching at eight frequencies: 0.25, 0.5, 1, 1.5, 2, 3, 4, and 6 kHz. We counted the number of frequencies of the output within the range and calculated the percentage of target matches per condition. Following the recommendations of Holube et al. [10], we used the whole duration of the ISTS (60 seconds) and only recorded the last 45 seconds to let the algorithms adjust to the signal.
Measuring SNR improvements using a head and torso simulator
We investigated the efficiency of the apps’ NR after assessing the processing delay and conducting the HIT based our experiment on that of De Sousa et al. [7]. We used speech signals with triplets of digits as stimuli, allowing breaks between each digit for speech detection and a stationary noise weighted in the speech spectrum as noise. We used the Head and Torso Simulator (Brüel & Kjær 4128-C; Brüel & Kjær, Egham, Surrey, UK) for the recording. The speaker at ear height was positioned 3 m from the Head and Torso Simulator. The smartphone’s volume was set at 100% with the gain for each app at 50%. All other parameters were deactivated. For the hearing aid, all features including the microphone directionality were deactivated. We only changed the NR parameter (on/off), resulting in two recording conditions. Similar to the HIT, we used a normal hearing flat audiogram for each device. The input signal with speech and noise was presented at 70 dB SPL with the digits and the noise at an equivalent level (67 dB SPL each). For the first 15 seconds, only the noise was presented. Then, we recorded the speech and noise for 45 seconds. The noise signal was presented at exactly the same level as in the speech and noise signal, and the recording also lasted 45 seconds. We calculated the SNR by subtracting the global sound levels of the speech and noise and the noise alone. Then, the SNR improvement was calculated by subtracting the SNR value without NR by that with NR. The measurements were conducted down to 6 kHz.
RESULTS
Processing delay
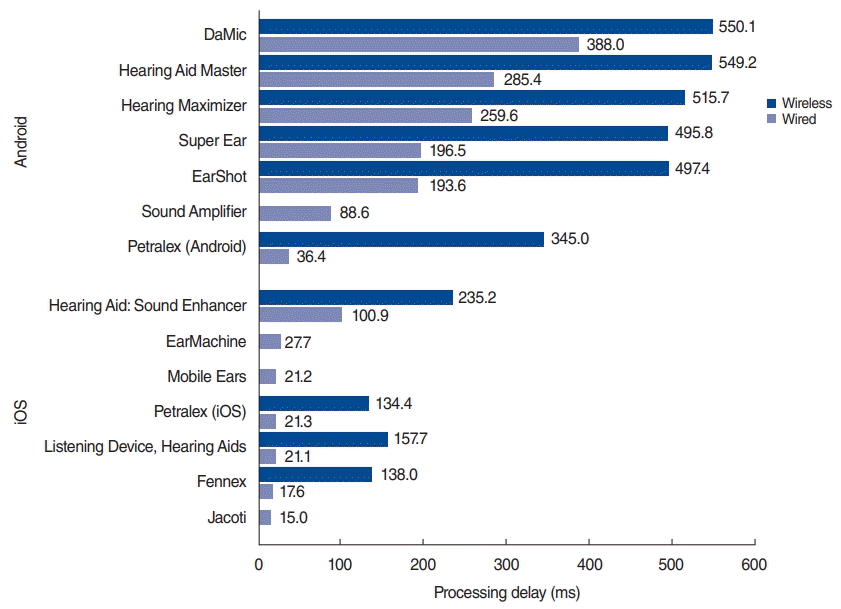
The wired earbuds had a shorter processing delay for clicks than the wireless earbuds (Fig. 2). Four apps did not provide wireless options. Five of the seven Android apps had a prolonged delay that exceeded 100 ms. Petralex and Sound Amplifier had processing delays of 36.3 ms and 88.6 ms, respectively. The iOS apps tended to show better results than the Android apps. Petralex, which is compatible with both Android and iOS, had a shorter delay on iOS than on Android.
Hearing instrument testing
We observed no differences in HIT outcomes after conducting measurements twice; the recordings presented the same shape and the variation in the values was less than 1 dB. As none of the apps were considered special-purpose hearing aids, there was no specific low-frequency emphasis among the different hearing aid apps.
The maximum OSPL90 values were noticeably different between the high- and low-end apps and between the two operating systems (Fig. 3). The high-end iOS apps and the low-end app Hearing Aid: Sound Enhancer had the highest values, which were close to that of the hearing aid. Petralex, which was the only high-end Android app, had the highest value of any Android app (>105 dB SPL). The OSPL90 values of all other apps were below 105 dB SPL, and the lowest values indicated that some apps were not even able to transmit the initial input of 90 dB SPL. The HFA OSPL90 values of the 14 apps generally showed the same pattern (Fig. 4). However, Hearing Aid: Sound Enhancer was similar to the other low-end apps; its high maximum OSPL90 was caused by high, focused amplification and was not indicative of overall high output.
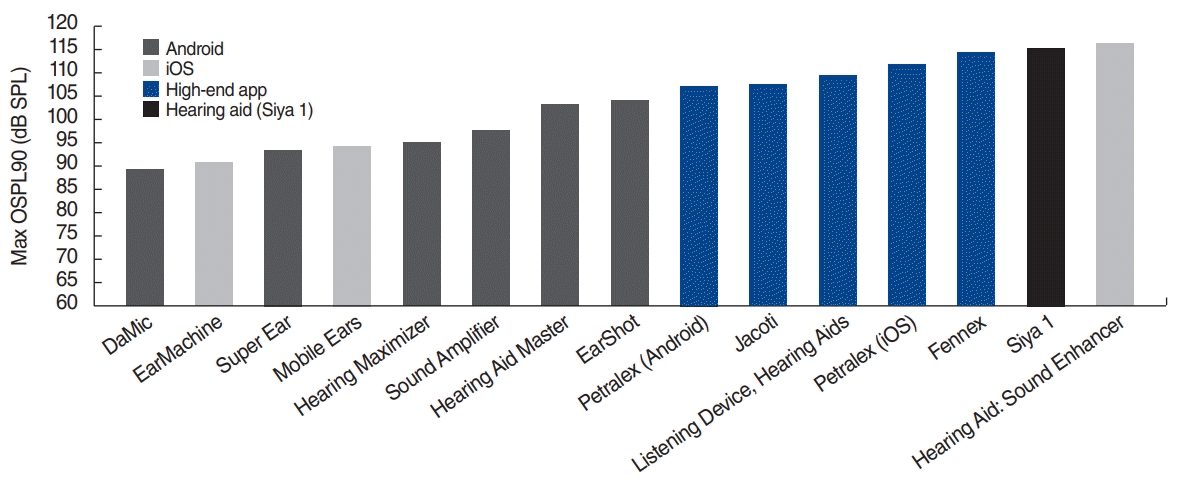
Maximum OSPL90 values of 14 hearing aid apps and a hearing aid (Siya 1). OSPL, output sound pressure level; app, application.

HFA OSPL90 values of 14 hearing aid apps and a hearing aid (Siya 1). HFA, high-frequency average; OSPL, output sound pressure level; app, application.
The HFA FOG values for the apps were far lower than that of the hearing aid, and 11 apps had HFA FOG values less than half that of the hearing aid (Fig. 5). The high-end apps had relatively consistent values (15–20 dB SPL; 30 dB SPL for Petralex on Android). The HFA FOG values for Sound Amplifier and Hearing Aid: Sound Enhancer were similar, and we found that they limited their output in response to the 90 dB SPL input of the OSPL90 measure.
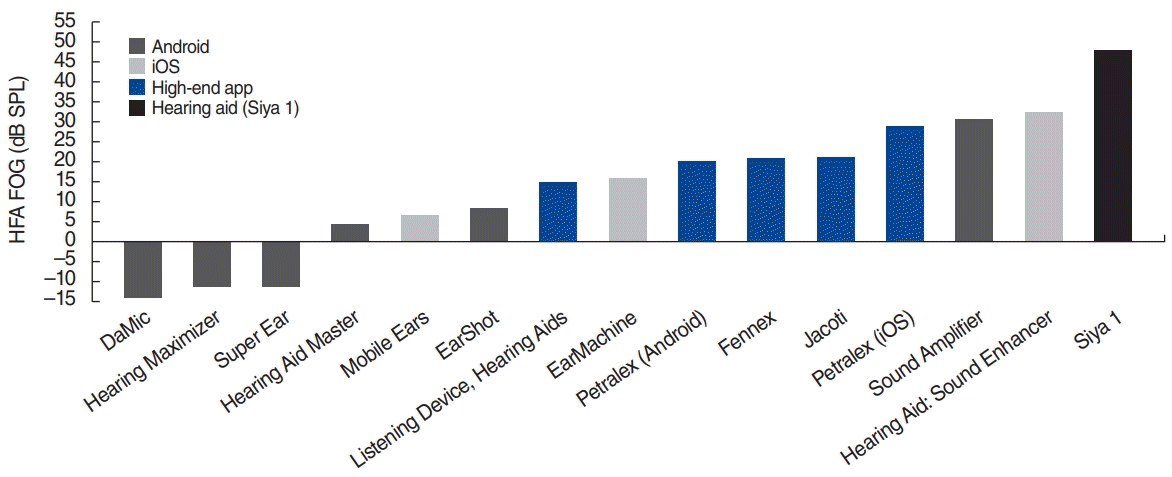
HFA FOG values of the 14 hearing aid apps and a hearing aid (Siya 1). HFA, high-frequency average; FOG, full on gain; app, application.
Five of the seven Android apps had a similar responses (OSPL90 output curve) with peaks >4 kHz; these apps were also among the six with the lowest HFA FOG values (Fig. 5). The EIN and THD results were highly variable (Table 2). Only the Mobile Ears app had an acceptable EIN value, while the values for the others varied from 30 dB SPL to nearly 60 dB SPL. The THD values were mostly low and below the tolerance level, with some values comparable to that of the hearing aid. Sound Amplifier, Mobile Ears, and Super Ear had high maximum THD values. There were no differences between high-end and low-end apps in terms of EIN and THD.
Simulated real ear measurements
Based on the processing delays and HIT results, we excluded all Android apps except Petralex and Sound Amplifier from subsequent testing. Fennex only allows the self-audiometry feature through direct testing; therefore, entering the four reference test audiograms was not possible.
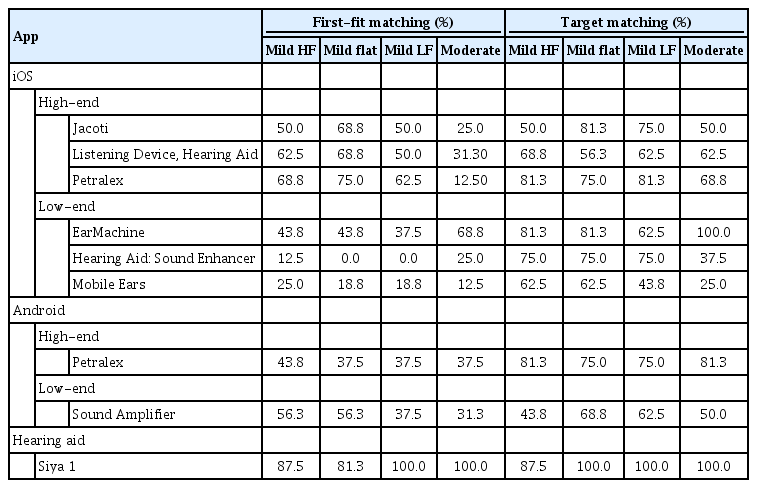
The highest scores for first-fit 50% gain were found for the high-end iOS apps (Petralex, Jacoti, and Listening Device, Hearing Aid hereafter) (Table 3). However, the overall percentage of matched targets remained low for all apps. The target-matching table showed that all apps except Mobile Ears and Sound Amplifier were flexible enough to match 75% or more of the selected frequencies. Even the low-end app EarMachine had flexible amplification, allowing it to match most targets. There were no categorical differences between the high-end and low-end apps or the two operating systems; rather, the differences were associated with the apps themselves. We also found that the apps were able to amplify down to at least 6 kHz. The hearing aid showed the best results and scored nearly 100% in most configurations.
SNR improvement
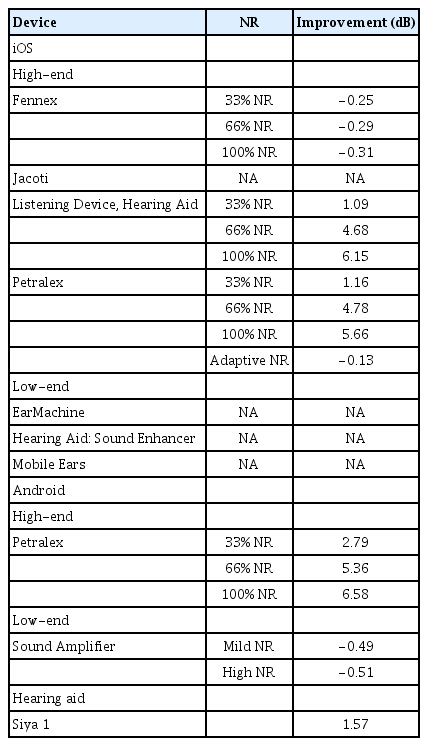
Apps that did not offer control over NR were not tested. We found that the NR settings did not improve SNR in Sound Amplifier or Fennex, but did for Petralex, Listening Device, and the hearing aid (Table 4).
DISCUSSION
Our results revealed clear differences among the tested apps. All Android apps exceeded the recommended level for processing delay, with Petralex and Sound Amplifier showing the shortest delays. Among the iOS apps, only Hearing Aid: Sound Enhancer exceeded the recommended processing delay. The HIT showed higher amplification characteristics and better sound quality for the hearing aid, followed by the high-end apps and then the low-end apps. In addition, the five apps with the longest delays were also among the apps with the lowest outputs (Figs. 1-4). However, the high-end apps had similar OSPL90 and FOG measurements to the hearing aid (Figs. 2 and 3). The apps generally had unacceptable EIN values, which reached almost 60 dB SPL for Petralex on Android and Sound Amplifier. The S-REM results showed that the high-end apps had a better ability to match the amplification targets, but there was no consistent pattern among apps when controlling the output. We found that the NR settings of Petralex, Listening Device, and the hearing aid improved SNR.
The delay using Bluetooth earbuds was too high (both of the smartphones used Bluetooth ver. 5.0), and wired earbuds were better by at least 100 ms in terms of processing delay. Such delays result in a perceptible echo between the initial voice of the speaker and the delayed processed voice. This measure accounts for the entire processing delay, meaning that it also depends on the characteristics of the smartphone being used (e.g., operating system, firmware, and age of components). Therefore, a proportion of the delay reported here depends on the device alone. However, since some apps had inferior scores on the same device, we can conclude that these differences in the processing delay depended mainly on the app. The more features that digital sound processing incorporates (e.g., the number of channels, NR, and feedback reduction), the more costly it will be in terms of delay [12]. The evaluated iOS apps tended to offer more functionalities than the Android ones but still performed better. There may be several reasons of the lower overall processing delay of the iOS apps compared to the Android apps. First, there have been new innovations at all stages of digital sound processing (e.g., digital filter bank systems and sampling methods). In addition, algorithms become more efficient and more adapted to the hardware they use over time; thus, a hearing device may offer a wide range of features while providing lower delay. Besides that, apps available via Android may have more basic sound processing with negative implications in terms of delay. The difference in the delay between wired and wireless modes tended to be larger in the Android apps. Since AirPods Pro were specifically developed for the iPhone, it is reasonable to assume that the delay has been optimized, even if the two smartphones are using the same built-in Bluetooth version. Another issue to consider is how well the earbuds fit the user. Open fittings may reduce the disturbance [13] from the initial 20–30 ms to 5–6 ms. Using standardized earbuds, even closed tips may not fit every ear. Therefore, a proportion of users may not experience adequate amplification even when using an app with a satisfactory delay.
We could not compare our results related to amplification characteristics with those of previous studies because few studies have explored these characteristics and the apps are no longer comparable; one app tested by Amlani et al. [5] is no longer available, while another has been reworked since the publication of that study. The maximum OSPL90 values highlighted the differences between the high-end and low-end apps. The values for high-end apps were similar to those of the hearing aid, indicating that they may adequately preserve the sound dynamic. However, the results for other apps were <105 dB SPL, which may affect the quality of high-level inputs. The OSPL90 values may increase by a few decibels for high-end apps depending on the audiogram recorded. We chose flat normal hearing to obtain comparable values between low- and high-end apps. We can conclude that the tested devices were not harmful for users under our configuration. However, users may have different results if they use different brands of earbuds or headphones, which may not be calibrated to the smartphones [6].
The clear differences in HFA FOG between the apps and the hearing aid showed that the hearing aid could deliver far superior gain in response to a 50 dB SPL input. This also illustrates the limited signal amplification of the apps and explains why it may be inappropriate to use them in individuals with more hearing impairment. Moreover, we observed that five low-end apps were consistently unable to deliver adequate gain, meaning that they are unlikely to benefit the user in any listening situation. OSPL90 testing showed high-frequency peaks for these five low-end Android apps, indicating that they use the same amplification method. Those were also the apps with the highest processing delays and low gain and output. The high-frequency peaks make it even more unlikely that they will improve intelligibility [14]. There were no differences in the other sound quality parameters between the iOS and Android apps, or between high-end and low-end apps. A low THD implies that the circuitry (smartphone+earbuds) is able to transmit a signal without altering the sound quality. However, a high EIN may present a significant inconvenience when listening through the apps. Agnew [15] reported that considerable distortion of the signal does not affect intelligibility in a quiet listening situation, but the user will face unpleasant sound quality. EIN will be audible if the initial background noise associated with the gain of the device produces a sound louder than the hearing threshold of the listener [16]. This is even more important for those with normal or mild hearing impairment, as they still have good perception of low sound levels. A tolerable EIN is reportedly around 30 dB SPL [1].
The hearing aid easily met the amplification requirements for the different audiometric configurations chosen in this study, but the hearing aid apps had more difficulties. In the first-fit configuration, as expected, the high-end apps with a self-audiometry feature performed better, but the overall matching percentage was still relatively low. Petralex on iOS performed best but reached 75% for only one configuration. Under our target-matching configuration, all apps had better results, although the percentages were far lower than those of the hearing aid. The adjustability of gain did not depend on the category of the app or on the smartphone used. Although the sound level of the targets was easy to reach, it was difficult to adjust the gain according to the frequency. Most apps provided only an equalizer between low and high frequencies, but this usually did not allow correct gain adjustment. Even the most feature-rich apps had difficulty meeting the targets. Furthermore, the more control an app offers over its features, the more difficult it is for the user to manage amplification.
We found clear improvements in SNR for some apps (up to 6.58 dB), while others did not appear to change (e.g., Sound Amplifier and Fennex). Therefore, we expect that devices with better results would improve speech intelligibility. The main effect of NR is to improve comfort rather than intelligibility, which is achieved mostly by a reduction of the overall gain. Therefore, we assume that even apps that did not improve SNR may benefit users in terms of reduced fatigue and stress [17].
Through this study, we clearly determined the characteristics of usability, sound quality, and amplification for hearing aid apps. These results are helpful for distinguishing among the wide range of apps available today as hearing aid apps or hearing amplifier apps. This approach also highlighted some challenges that the apps would need to overcome to increase their efficiency. The processing delay is still too noticeable in a significant number of apps, which may affect intelligibility. Furthermore, the sound quality (i.e., sound distortion and internal noise) may remain poor. Also, there is a need for personalization of amplification with the goal of performing as accurately as possible; some apps offer a self-audiometry feature and the basic use of the app is intuitive and simple. However, when there are additional features, the instructions to adjust the sound may remain vague for the user, which may be an issue considering that most users would be elderly and less familiar with this technology. We could imagine a questionnaire through the app that would adjust the amplification according to the user’s answers. Beyond the electroacoustic evaluation, this study could benefit from an additional behavioral evaluation among a group of daily users, and the accessibility of those apps would make it possible to test a large number of subjects and have feedback on their daily use. Apps are clearly advantageous in terms of their accessibility and convenience, but they may not offer enough benefits to support their use when hearing impairment becomes significant. Regular updates of apps and the growing development of direct-to-consumer devices may allow hearing aid apps to play a more important role in hearing rehabilitation and awareness among the general population in the future.
HIGHLIGHTS
▪ The electroacoustic performance of most applications (apps) was poorer than that of a hearing aid.
▪ Many hearing aid apps exceeded the recommended level for processing delay.
▪ High-end apps had a better ability to match amplification targets than low-end apps in simulated real-ear measurements.
▪ Only a few apps improved the signal-to-noise ratio in a head-and-torso simulator.
Notes
No potential conflict of interest relevant to this article was reported.
AUTHOR CONTRIBUTIONS
Conceptualization: all authors. Data curation: WN, MK. Visualization: WN, MK. Writing–original draft: WN. Writing–review & editing: WN, MKP.
Acknowledgements
We are grateful to Ms. Ye Jin Byeon for her help in collecting data. This research was supported by a grant from the Patient-Centered Clinical Research Coordinating Center funded by the Ministry of Health & Welfare, Republic of Korea (grant number: HI19C0481, HC19C0128). We thank Dr. Cho Wan-Ho and Dr. Chang Jiho from the Korea Research Institute of Standards and Science (KRISS; Daejeon, Korea) for their help and thoughtful advice regarding signal-to-noise ratio measurements using their material.

